Açıklama
ÖNEMLİ NOTLAR - ÖNCE OKUYUN
Forex Hacmi Gerçek Hacim Değildir
Forex'teki hacim, tik hacmidir — fiyatın kaç kez değiştiğini sayar. Ne kadar para işlem gördüğünü SAYMAZ.
Tik Hacminin Gösteremediği Şeyler
- İşlem büyüklüğü. 100$'lık bir işlem ile 10.000.000$'lık bir işlem ikisi de 1 tik olarak sayılır.
- Gerçek para akışı. Fiyatı büyük para mı yoksa küçük para mı hareket ettirdiğini göremezsiniz.
- Gerçek likidite. Piyasada kaç emrin beklediğini göremezsiniz.
- Banka faaliyetleri. Bankalar gerçek hacim verilerini görür. Siz göremezsiniz.
Bu Ne Anlama Geliyor
Tik hacmi sadece fiyatın ne kadar sık değiştiğini gösterir — arkasındaki parayı değil. Bu sorunlar yaratır:
- Bankaları veya kurumları takip edemezsiniz. Onlar sizin erişiminiz olmayan gerçek hacim verilerini kullanır.
- "Akıllı para" teorilerini kanıtlayamazsınız. Bu fikirler gerçek hacim, tik sayımı değil, gerektirir.
- Gerçek likiditeyi değerlendiremezsiniz. Tik aktivitesi emir derinliğini veya gerçek piyasa gücünü göstermez.
- Gerçek alım veya satım gücünü ölçemezsiniz. Birçok küçük işlem, büyük bir kurumsal işlemle aynı görünür.
- Hacim sıçramaları yanıltıcı olabilir. Bir sıçrama sadece algoritmik gürültü olabilir, gerçek işlem ilgisi olmayabilir.
Bu Göstergesi Doğru Kullanma Yöntemi
- Bunu para ölçer değil, bir aktivite ölçer olarak değerlendirin. Yüksek tik hacmi = piyasa meşgul. Düşük tik hacmi = piyasa sakin. Başka bir şey değil.
- Farklı zamanlar arasındaki aktiviteyi karşılaştırın. Şunu görmek için kullanın: Londra seansı New York'tan daha mı yoğun? Bugün dünle kıyaslandığında daha mı aktif? Trend dönemi konsolidasyondan daha mı yoğun?
- Bunu fiyat yapısıyla birleştirin. Destek/direnç, salınım noktaları veya BOS/ChoCH ile hacmi birlikte kullanın. Fiyat bağlamı, gürültülü hacim sıçramalarından kaynaklanan yanlış sinyalleri önler.
- Önemli fiyat seviyelerindeki aktiviteyi izleyin. Fiyat kritik bir seviyeyi test ettiğinde ve tik hacmi arttığında, daha fazla trader aktif demektir. Bu, büyük oyuncuların dahil olduğu anlamına GELMEZ.
- Bunun kurumsal aktiviteyi gösterdiğini varsaymayın. Tik hacmi birikim, büyük emirler veya "akıllı para" gösteremez. Sadece ritim ve tempo ölçmek için kullanın.
__________________________________________________________________________________________
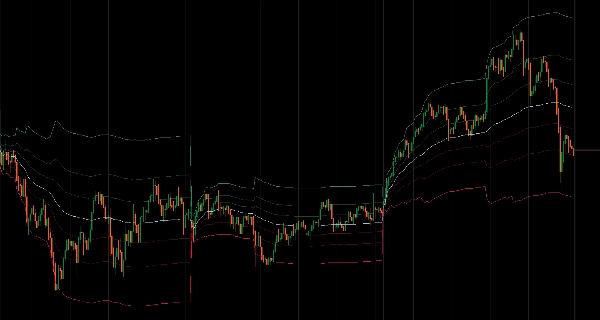
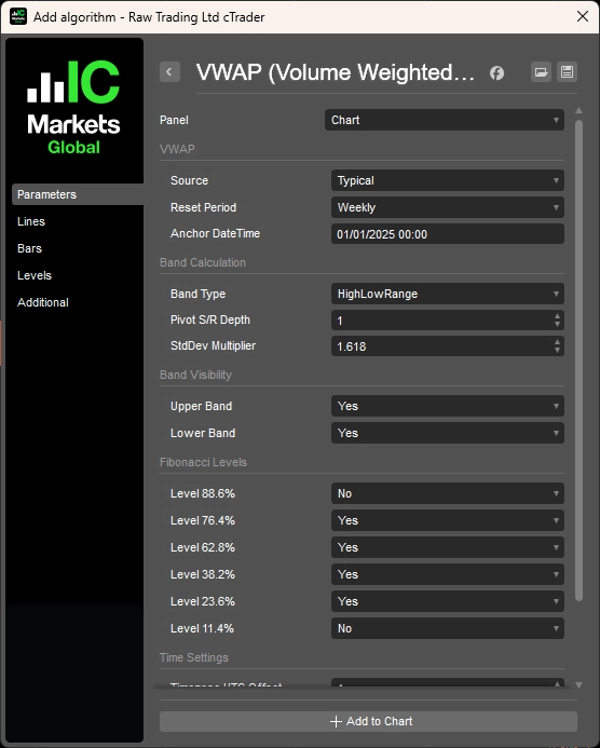
Esnek sıfırlama periyotları ve üç bant hesaplama yöntemi ile Hacim Ağırlıklı Ortalama Fiyat.
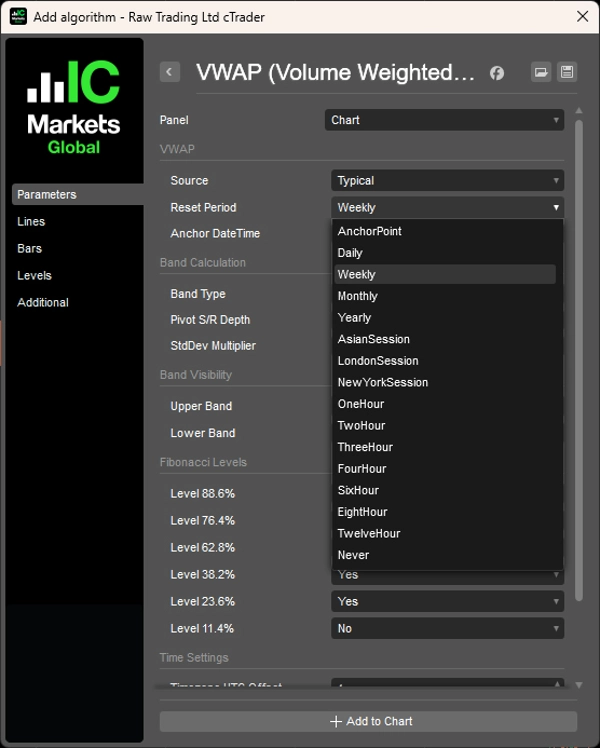
Günlük, haftalık, aylık, yıllık veya özel saatlik zaman aralıkları dahil esnek sıfırlama periyotları ile Hacim Ağırlıklı Ortalama Fiyatı hesaplar; oturum bazlı sıfırlamalar (Asya, Londra, New York, yapılandırılabilir başlangıç saatleri ile), VWAP'ı belirli olaylara sabitlemek için çapa noktası modu veya mevcut tüm verilerden sürekli hesaplama.
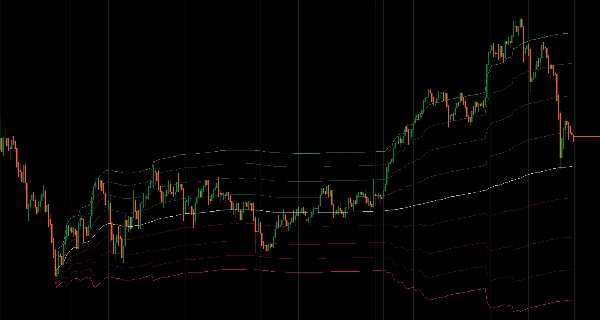
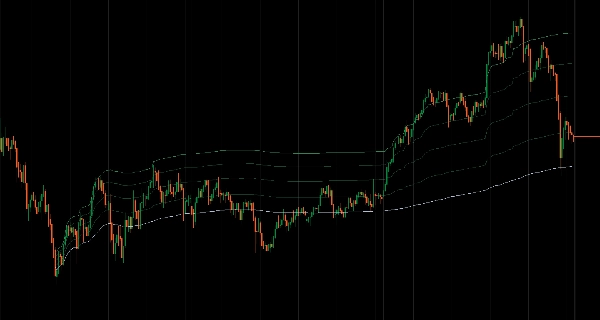
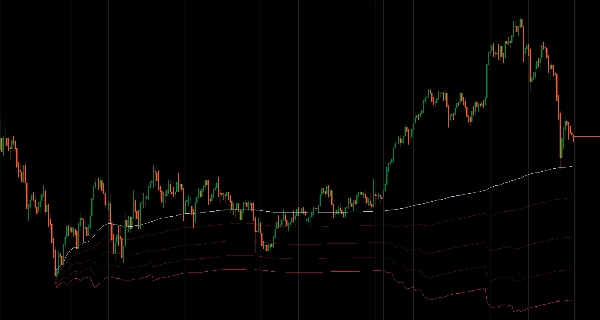
Üç bant hesaplama yöntemi sunar: Önceki dönemin fiyat aralığına dayalı Yüksek/Düşük Aralık, klasik pivot hesaplamalarını kullanan Fibonacci Pivot ve volatilite ile genişleyip daralan Standart Sapma bantları.
Sekiz Fibonacci seviyesi (100%, 88.6%, 76.4%, 62.8%, 50%, 38.2%, 23.6%, 11.4%, 0%) bireysel görünürlük anahtarları ve hızlı üst/alt bant grup kontrolleri ile özelleştirilebilir. Oturum yönetimi, UTC ofset ayarı (-12 ila +14 saat) ile tam başlangıç zamanı yapılandırması ve saat dilimine duyarlı saatlik sıfırlama işlemi içerir.
ÖZELLİKLER
- Esnek Sıfırlama Periyotları
-
- Zamana dayalı: Günlük, Haftalık, Aylık, Yıllık veya özel saatlik aralıklar (1S, 2S, 3S, 4S, 6S, 8S, 12S)
- Oturum bazlı: Yapılandırılabilir başlangıç saatleri ve saat dilimi ofsetleri ile Asya, Londra, New York oturumları
- Çapa Noktası: VWAP'ı olay odaklı analiz için herhangi bir belirli tarih ve saate sabitleme
- Sürekli: Sıfırlama olmadan mevcut tüm verilerden hesaplama
- Üç Bant Hesaplama Yöntemi
-
- Yüksek/Düşük Aralık: Önceki dönemin fiyat aralığına dayalı bantlar
- Fibonacci Pivot: Önceki dönemin Y/D/K'sından klasik pivot noktası hesaplaması
- Standart Sapma: Volatilite ile genişleyen/daralan geleneksel istatistiksel bantlar
- Tam Fibonacci Seviye Kontrolü
-
- 8 özelleştirilebilir seviye: 100%, 88.6%, 76.4%, 62.8%, 50% (VWAP), 38.2%, 23.6%, 11.4%, 0%
- Bireysel seviye görünürlük anahtarları
- Hızlı ayar için üst/alt bant grup kontrolleri
- Oturum Yönetimi
-
- UTC ofset ayarı (-12 ila +14 saat) ile tam oturum başlangıç saatlerini yapılandırma
- Görsel oturum bilgisi ekranı mevcut sıfırlama programını gösterir
- Saat dilimine duyarlı saatlik sıfırlama işlemi
- Performans Optimizasyonu
-
- Tembel hesaplama—bantlar sadece görünür olduğunda hesaplanır
- Akıllı önbellekleme ve toplu işlem
- Tüm seviyeler etkinleştirildiğinde bile minimum CPU etkisi
__________________________________________________________________________________________
DAHA FAZLA ÜCRETSİZ GÖSTERGE
Yapı ve hacimden regresyon, volatilite ve özel zaman dilimlerine kadar geniş bir piyasa analiz araçları yelpazesini keşfedin.
Kaynak kodu GitHub deposunda mevcuttur.
Kullanımı tamamen ücretsizdir. Ancak kahve desteği göndermek isterseniz, buradan yönlendirebilirsiniz.
Destek/Direnç
Hacim
- Hacim Aktivite Profili
- Hacim Verimlilik Analizörü
- Hacim Profili Analitiği
- Hacim Profili - Güncellenmiş
- Hacim Yayılım Analizi
- VWAP (Hacim Ağırlıklı Ortalama Fiyat)
Hareketli Ortalamalar
- SSL Kanalı
- Çapalanmış Hareketli Ortalama
- Sapma Ölçekli Hareketli Ortalama
- Gann Yüksek Düşük Aktivator
- Anlık Trend Çizgisi
- Trend Vizyonlu Kaufman Adaptif HO
- Hareketli Ortalama Kanalı
- Hareketli Ortalamalar Paketi
- Trend Kanalı Hareketli Ortalaması
Araçlar/Özel
Regresyona Dayalı
Volatilite
Osilatörler
__________________________________________________________________________________________
FERAGATNAME
Ticaret risk içerir. Bu gösterge sadece teknik analiz amaçlıdır — her zaman uygun risk yönetimi uygulayın ve sorumlu şekilde işlem yapın.
GERİ BİLDİRİM & GELİŞTİRMELER
Önerileriniz, özellik talepleriniz veya geliştirme fikirleriniz varsa, lütfen Tartışma sekmesinde yorum bırakın. Geri bildiriminiz göstergenin herkes için iyileştirilmesine yardımcı olur.
Özet
The indicator offers three band calculation methods: High/Low Range bands based on the previous period's price range, Fibonacci Pivot bands using classical pivot calculations, and Standard Deviation bands that adjust with market volatility. Users can customize eight Fibonacci levels (ranging from 0% to 100%) with individual visibility toggles and group controls for upper and lower bands.
Session management features include precise start time configuration with UTC offset adjustments and timezone-aware hourly resets, along with visual session information display. Performance optimizations include lazy calculation of bands only when visible, intelligent caching, and batch processing to minimize CPU usage.
Note: For forex markets, volume data represents tick volume (price change counts) rather than actual traded volume, so this indicator should be used as a measure of market activity rather than real money flow. It is intended for technical analysis with proper risk management.
Müşteri değerlendirmeleri
5 | 100 % | |
4 | 0 % | |
3 | 0 % | |
2 | 0 % | |
1 | 0 % |