
FZ
Gösterge
Sürüm 1.0, Mar 2026
Windows, Mac
4.0
Değerlendirmeler: 2
Açıklama
cTrader için FZ Göstergesi
Açıklama
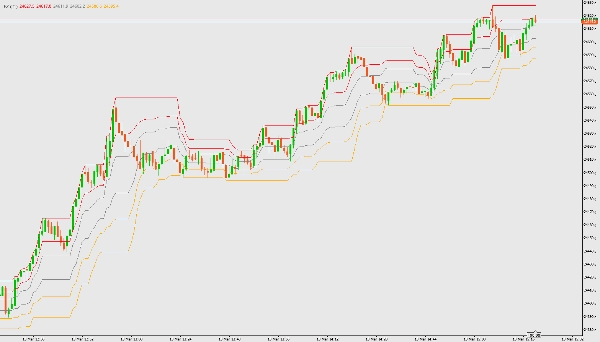
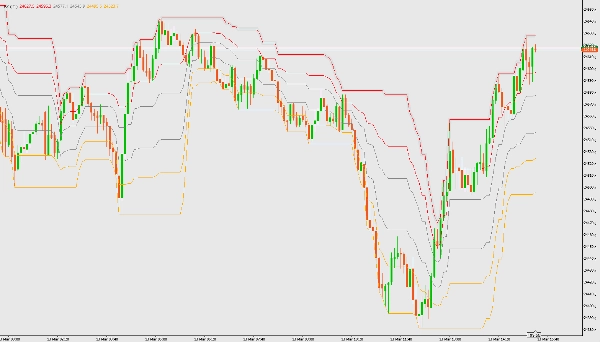
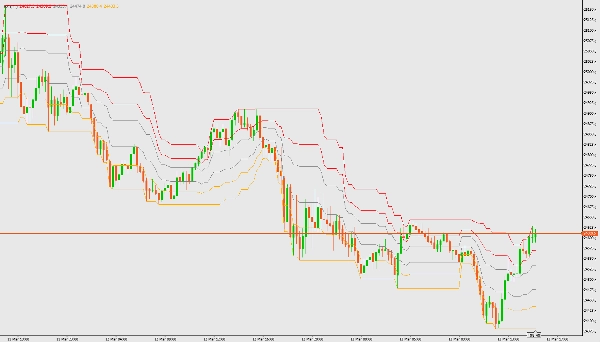
FZ göstergesi, kullanıcı tarafından tanımlanan bir dönem boyunca en yüksek ve en düşük fiyatlara dayalı Fibonacci kanal bölgelerini çizer. Trend bölgelerini ve potansiyel dönüş alanlarını belirlemeye yardımcı olur.
Özellikler
- Kanal sınırlarını ve Fibonacci seviyelerini hesaplar (0.236, 0.382, 0.618, 0.786)
- Yükselen trend, yatay ve düşen trend bölgelerini görselleştirir
- Fiyat grafiği üzerine bindirme
Parametreler
- son ## bar için hesapla: Hesaplama için kullanılacak bar sayısı (varsayılan: 21)
Nasıl Kullanılır
- FZ gösterge dosyasını (FZ.cs) indirip cTrader platformunuza ekleyin.
- Göstergeleri cTrader Automate'de derleyin.
- Göstergeleri herhangi bir grafiğe ekleyin.
- Bar sayısı parametresini ihtiyaca göre ayarlayın.
- Renkli bölgeleri yorumlayın:
-
- Camgöbeği: Yükselen trend bölgesi (uzun pozisyon aç)
- Gri: Yatay bölge (trend değişimini bekle)
- Turuncu: Düşen trend bölgesi (kısa pozisyon aç)
Özet
Gösterge profili
Müşteri değerlendirmeleri
4.0
Değerlendirmeler: 2
5 | 0 % | |
4 | 100 % | |
3 | 0 % | |
2 | 0 % | |
1 | 0 % |
Tartışma
SSS
BTCUSD
Forex
Signal
Breakout
Indices
EURUSD
Commodities
GBPUSD
NZDUSD
Prop
Scalping
Crypto
Grid
Stocks
AI
XAUUSD
NAS100
USDJPY
cTrader Store üzerinden erişilebilen işlem botları, göstergeler ve eklentiler gibi ürünler, üçüncü taraf sağlayıcılar tarafından sağlanır ve yalnızca bilgilendirme ve teknik erişim amaçlarıyla sunulur. cTrader Store bir broker değildir ve yatırım tavsiyesi, kişisel öneriler vermez veya gelecekteki performansı garanti etmez.
Bu oluşturanın diğer ürünleri


Fiyat
Başlangıç 10/03/2026
105
Ücretsiz yüklemeler