
Sero
Gösterge
105 i̇ndirmeler
Sürüm 1.0, Mar 2026
Windows, Mac
Açıklama
Sero — Momentum Osilatörü
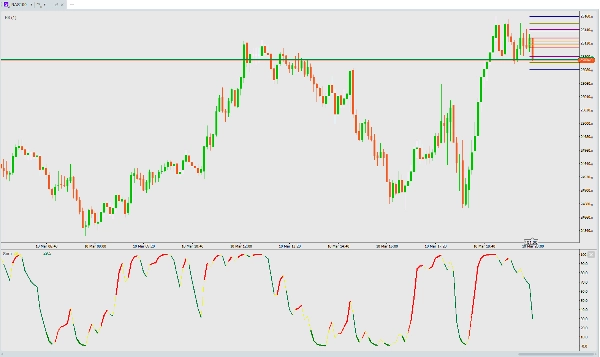
Sero, piyasa momentumu değişimleri için net, renk kodlu görsel sinyaller veren stokastik tabanlı bir momentum osilatörüdür.
Nasıl Çalışır
Sero, 15 bar aralığında Tipik Fiyat (Yüksek+Düşük+Kapanış)/3 değerinden düzeltilmiş bir stokastik değer hesaplar, ardından hızlı 2 periyotluk EMA uygular ve tepki veren 0–100 arası bir osilatör üretir.
Nelere Dikkat Edilmeli
Renkler durumu anlatır:
- Sarı çizgi — temel Sero değeri (her zaman görünür)
- Kırmızı çizgi — yükselen momentum (Sero yükseliyor)
- Kalın Kırmızı çizgi — güçlü yükseliş momentumu (yükseliyor + 20’nin üzerinde — aşırı satımdan çıkış onayı)
- Yeşil çizgi — düşen momentum (Sero düşüyor)
- Kalın Yeşil çizgi — güçlü düşüş baskısı (düşüyor + 20’nin altında — aşırı satım bölgesinde derinleşme)
Ana sinyaller:
- Alış sinyali — Renk Yeşilden Kırmızıya döner, özellikle 20’nin altından (aşırı satım dönüşü)
- Satış sinyali — Renk Kırmızıdan Yeşile döner, özellikle 80’in üzerindeyken (aşırı alım dönüşü)
- Güçlü trend — Kalın çizgiler momentum kararlılığını teyit eder
- Tükenme — 20’nin altında Kalın Yeşil = satıcıların gücü tükeniyor olabilir, dönüşe dikkat edin
En İyi Uygulamalar
- Her zaman diliminde çalışır ve herhangi bir enstrümanda
- Onay için fiyat hareketi veya destek/direnç seviyeleri ile birleştirin
- Aşırı uçlara (0 veya 100) yakın renk geçişleri en yüksek olasılıklı sinyallerdir
- Ayar gerekmez — kutudan çıkar çıkmaz optimize edilmiş ve kullanıma hazır
Özet
YZ özeti
Sero is a stochastic-based momentum oscillator designed to identify market momentum shifts through clear, color-coded visual signals. It calculates a smoothed stochastic value from the Typical Price [(High + Low + Close) / 3] over a 15-bar range, then applies a fast 2-period exponential moving average (EMA) to generate a responsive oscillator ranging from 0 to 100.
The indicator displays multiple colored lines to represent momentum states:
- Yellow line: base Sero value (always visible)
- Red line: bullish momentum (rising oscillator)
- Thick red line: strong bullish momentum (rising and above 20, indicating breakout from oversold)
- Green line: bearish momentum (falling oscillator)
- Thick green line: strong bearish momentum (falling and below 20, indicating deep oversold conditions)
Key signals include buy signals when the color flips from green to red, especially below 20 (oversold reversal), and sell signals when it flips from red to green, especially above 80 (overbought reversal). Thick lines confirm strong momentum trends, while thick green lines below 20 may indicate exhaustion of selling pressure and potential reversal.
Sero works on any timeframe and instrument without requiring user settings, and it is recommended to combine it with price action or support/resistance levels for confirmation. Color transitions near extremes (0 or 100) provide the highest-probability signals.
Gösterge profili
Müşteri değerlendirmeleri
0.0
Değerlendirmeler: 0
Müşteri değerlendirmeleri
Bu ürün için henüz bir değerlendirme yok. Ürünü denediniz mi? O zaman ona dair görüşlerini paylaşan ilk kişi olun!
Tartışma
SSS
BTCUSD
Forex
Signal
Indices
EURUSD
Commodities
GBPUSD
NZDUSD
Crypto
Stocks
XAUUSD
NAS100
USDJPY
cTrader Store üzerinden erişilebilen işlem botları, göstergeler ve eklentiler gibi ürünler, üçüncü taraf sağlayıcılar tarafından sağlanır ve yalnızca bilgilendirme ve teknik erişim amaçlarıyla sunulur. cTrader Store bir broker değildir ve yatırım tavsiyesi, kişisel öneriler vermez veya gelecekteki performansı garanti etmez.
Bu oluşturanın diğer ürünleri


Fiyat
Başlangıç 10/03/2026
105
Ücretsiz yüklemeler