
Area of Interest
Gösterge
2 satın almalar
Sürüm 1.0, Aug 2025
Windows, Mac
4.0
Değerlendirmeler: 2
Açıklama
1. Göstergenin Amacı
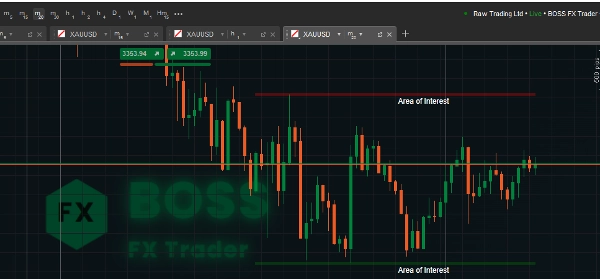
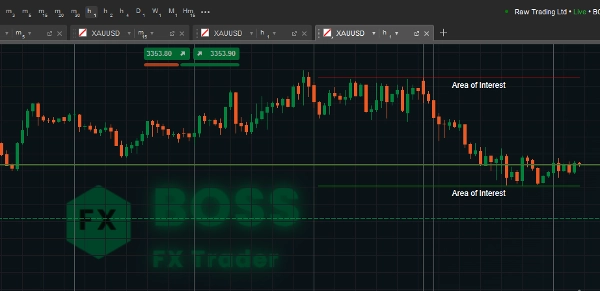
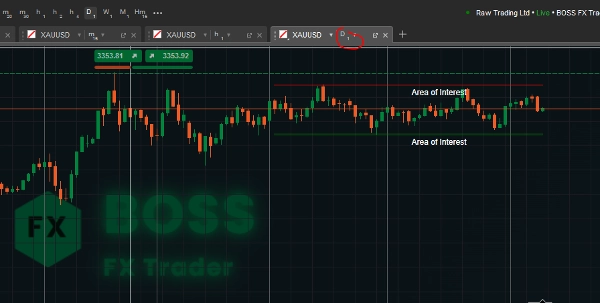
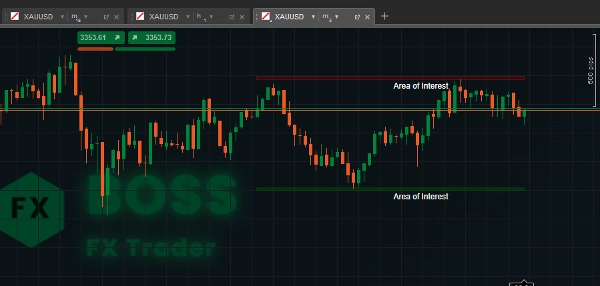
Bu İlgi Alanı cTrader göstergesi, kullanıcı tarafından tanımlanan geri bakış dönemi içinde destek ve direnç bölgelerini tespit eder ve bunları grafiğinizde “İlgi Alanları” olarak görsel şekilde vurgular.
Tüccarların dönüşlerin veya kırılmaların daha olası olduğu önemli fiyat seviyelerini hızlıca görmelerine yardımcı olur.
2. Kodun Çalışma Şekli
- Geri Bakış Dönemi – Gösterge, en yüksek yüksek ve en düşük düşük seviyeleri bulmak için tarayacağı önceki bar (mum) sayısıdır.
- Daha yüksek değerler → daha geniş bölgeler.
- Daha düşük değerler → daha güncel seviyeler.
- Bölge Yüksekliği – Destek/direnç alanının dikey boyutu (kalınlığı) pip cinsindendir.
- Bölgenin daha görünür ve ayarlanabilir olmasına yardımcı olur.
- Yeni çizimler yapılmadan önce eski çizimleri temizler, karışıklığı önler.
- Geri bakış aralığı için yüksek ve düşük fiyatları toplar.
- En yüksek ve en düşük fiyat seviyelerini (direnç & destek) bulur.
- Bölge yüksekliğini pip'ten gerçek fiyat değerine dönüştürür.
3. Kullanım Talimatları
- Göstergeleri Ekle
-
- cTrader'ı açın, bir grafik yükleyin, tıklayın Indicators → Custom → AreaOfInterest.
- Parametreleri Ayarla
-
- Geri Bakış Dönemi:
-
- Swing trading için → Daha büyük değerler kullanın (örneğin, 100–200).
- Scalping için → Daha küçük değerler kullanın (örneğin, 20–50).
- Bölge Yüksekliği: Ticaret stilinize ve enstrüman volatilitenize göre ayarlayın.
- Bölgeleri Yorumlama
-
- Kırmızı Bölge (Direnç) – Fiyat bu bölgeye girerken genellikle geri döner veya yavaşlar.
- Yeşil Bölge (Destek) – Fiyat genellikle buradan yukarı doğru sıçrar.
- Şunlara dikkat edin:
-
- Fiyat reddi
- Mum çubuğu desenleri (pin barlar, engulfing)
- Diğer göstergelerle uyum (EMA, RSI, Fibonacci)
- Ticaret Örnekleri
-
- Sıçrama Ticareti: Yeşil bölge yakınında uzun pozisyona girin ve hemen altına stop koyun.
- Kırılma Ticareti: Fiyatların kırmızı bölgenin üzerinde kapanmasını bekleyin, bu yükseliş kırılmasıdır.
- Yanlış Kırılma Tespiti: Bölge dışındaki fitillere dikkat edin ancak kapanış içerideyse (olası dönüşler).
Karlı bir tüccar bu aracı kullandı.
Özet
YZ özeti
Area of Interest is a cTrader indicator designed to identify and visually highlight key support and resistance zones on trading charts. It scans a user-defined lookback period to detect the highest highs and lowest lows, marking these as “Areas of Interest” to help traders recognize price levels where reversals or breakouts are more likely. Users can adjust the lookback period to focus on broader historical zones or more recent price levels, and set the vertical size (zone height) of these areas in pips for better visibility. The indicator clears previous drawings before plotting new zones to maintain chart clarity. Resistance zones are displayed in red, indicating potential price reversals or slowdowns, while support zones appear in green, suggesting possible price bounces. Traders can use these zones alongside price action signals such as candlestick patterns and other technical indicators to inform trading decisions. Typical applications include entering long positions near support zones, trading breakouts above resistance zones, and detecting false breakouts by observing price wicks relative to the zones. The indicator supports customization to suit different trading styles, including scalping and swing trading, by adjusting the lookback period and zone height parameters.
Gösterge profili
Müşteri değerlendirmeleri
4.0
Değerlendirmeler: 2
5 | 0 % | |
4 | 100 % | |
3 | 0 % | |
2 | 0 % | |
1 | 0 % |
Tartışma
SSS
cTrader Store üzerinden erişilebilen işlem botları, göstergeler ve eklentiler gibi ürünler, üçüncü taraf sağlayıcılar tarafından sağlanır ve yalnızca bilgilendirme ve teknik erişim amaçlarıyla sunulur. cTrader Store bir broker değildir ve yatırım tavsiyesi, kişisel öneriler vermez veya gelecekteki performansı garanti etmez.


Fiyat
Başlangıç 29/05/2025
3.04M
İşlem hacmi
45.22K
Kazanılan pip
29
Satışlar
769
Ücretsiz yüklemeler