Açıklama
SWING HACİM PROFİLİ (SVP)
Swing Tabanlı Hacim Profili + Fibonacci + RSI
--------------------------------------------------
Swing tespiti. Hacim profili. Fibonacci. RSI. Hepsi bir arada.
--------------------------------------------------
BU GÖSTERGE NE YAPAR
Swing Hacim Profili (SVP) yapısal swingleri otomatik olarak tespit eder ve en son tamamlanan swing için Fibonacci düzeltmesi ve RSI örtüşmesi ile birlikte bir hacim profili gösterir.
Manuel aralık seçimi gerekmez. Gösterge swingleri bulur ve profili otomatik olarak oluşturur.
--------------------------------------------------
ANA ÖZELLİKLER
- OTOMATİK SWING TESPİTİ (ayar yapılabilir derinlik ve sapma)
- Son tamamlanan swing için Hacim Profili
- Kontrol Noktası (POC) - en yüksek hacim seviyesi
- Değer Alanı (VAH + VAL) - ayarlanabilir yüzde
- Yüksek Hacimli Düğümler (HVN) - ortalamanın üzerindeki hacim eşiği
- Fibonacci Düzeltmesi (0, 23.6, 38.2, 50, 61.8, 78.6, 100)
- Mevcut fiyat yakınında RSI örtüşmesi
- Histogram konumu: Sol, Sağ veya Çubuklara Yakın
- Ayarlanabilir satırlar (10 ila 200)
- Özelleştirilebilir renkler ve opaklık
- Çizgileri sağa uzat
- Fiyat etiketlerini göster/gizle
- Yeniden çizim yok
--------------------------------------------------
NASIL ÇALIŞIR
1. Gösterge, ayarlanabilir derinlik ve sapma kullanarak swingleri tespit eder
2. Son tamamlanan swing belirlenir
3. Hacim profili swing aralığından hesaplanır
4. POC, VAH, VAL, HVN gösterilir
5. Fibonacci düzeltmesi swing üzerine bindirilir
6. Mevcut RSI fiyat yakınında gösterilir
Tamamen otomatik. Manuel giriş gerekmez.
--------------------------------------------------
GÖRSEL ÖĞELER
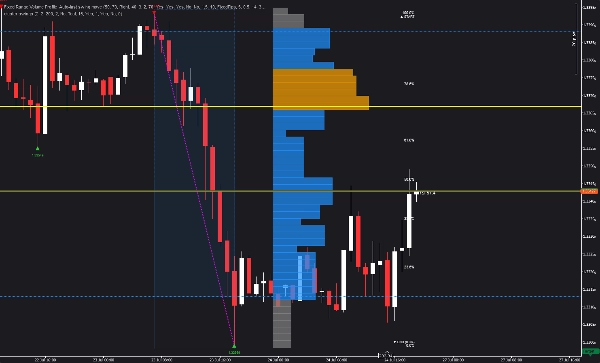
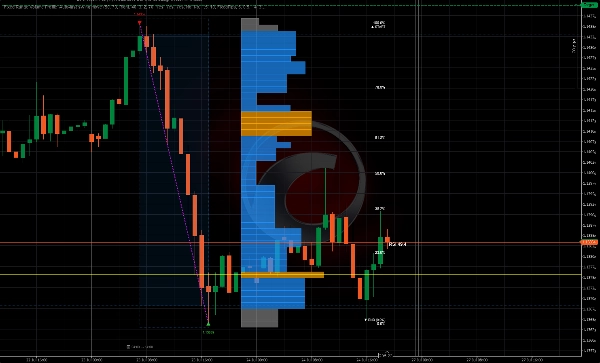
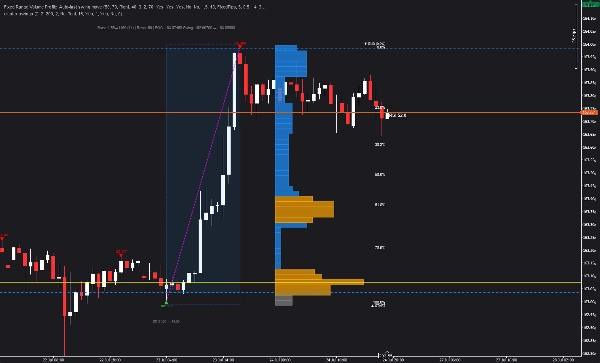
- Kırmızı aşağı üçgenler = Swing zirveleri
- Yeşil yukarı üçgenler = Swing dipleri
- Macenta noktalı çizgi = Swing bağlantısı
- Sarı yatay çizgi = Kontrol Noktası (POC)
- Mavi kesikli çizgiler = Değer Alanı Yüksek (VAH) ve Değer Alanı Düşük (VAL)
- Turuncu çubuklar = Yüksek Hacimli Düğümler (HVN)
- Gri çubuklar = Düşük hacimli düğümler
- Altın yatay çizgiler = Fibonacci seviyeleri
- Beyaz etiketler = Fibonacci yüzdeleri
- RSI değeri = Fiyat yakınındaki mevcut RSI
--------------------------------------------------
PARAMETRE GENEL BAKIŞ
PROFİL AYARLARI:
- Satır Sayısı: Kaç fiyat satırı (10-200)
- Değer Alanı Yüzdesi: Değer alanındaki hacim yüzdesi (1-100)
GÖRSEL AYARLAR:
- Histogram Pozisyonu: Sağ, Sol, Çubuklara Yakın veya Çubuklara Yakın Sol
- Histogram Genişliği %: Histogram çubuklarının genişliği
- Çubuk Genişliği Ölçeklendirmesi: Çubuk genişlikleri için ölçek faktörü
- Min Çubuk Genişliği %: Minimum çubuk genişliği
- Çubuk Opaklığı: Çubukların saydamlığı (10-100)
SWING TESPİTİ:
- Swing Derinliği: Yerel ekstremumlar için kaç çubuk kontrol edilecek
- Sapma Modu: Sabit Pips veya ATR Tabanlı
- Sabit Sapma: Swingler arasındaki minimum pip mesafesi
- ATR Sapma Çarpanı: ATR tabanlı sapma için çarpan
- ATR Periyodu: ATR hesaplama periyodu
- Geri Adım: Swingler arasındaki minimum çubuk sayısı
GÖRSEL - SWINGLER:
- Swing Çizgilerini Göster: Macenta swing çizgisini aç/kapa
- Swing Çizgi Rengi
- Swing Etiketlerini Göster: Fiyat etiketlerini aç/kapa
- Yüksek/Düşük Swing Renkleri
GÖRSEL - FİBONACCİ:
- Fib Düzeltmesini Göster: Fibonacci örtüşmesini aç/kapa
- Fib Çizgilerini Göster: Yatay çizgileri aç/kapa
- Fib Etiketlerini Göster: Yüzde etiketlerini aç/kapa
- Fib Çizgi Rengi / Fib Metin Rengi
GÖRSEL - RSI:
- RSI Değerini Göster: RSI örtüşmesini aç/kapa
- RSI Periyodu: RSI hesaplama periyodu
- RSI Etiket Rengi
RENKLER:
- POC Rengi / Değer Alanı Rengi / Yüksek Hacim Düğümü Rengi / Düşük Hacim Rengi
--------------------------------------------------
KULLANIM ALANLARI
- Bir görünümde swingleri ve hacim dağılımını tanımlayın
- Giriş ve çıkışlar için Kontrol Noktasını (POC) bulun
- Kar hedefleri için Değer Alanını (VAH/VAL) kullanın
- Ana seviyeler için Yüksek Hacimli Düğümleri (HVN) tespit edin
- Swinge Fibonacci düzeltmesi uygulayın
- RSI uyumu ile işlemleri onaylayın
- Hacim dağılımını bir bakışta anlayın
--------------------------------------------------
YAPISAL ISI BÖLGELERİNE YÜKSELTİN
Bu gösterge size swingleri ve hacim dağılımını gösterir.
Yapısal Isı Bölgeleri daha ileri gider — katılım yoğunluğunu, kabul ve reddi ve piyasa etkileşimini birden fazla bölgede haritalar.
cTrader Mağazasında Yapısal Isı Bölgelerini arayın.
--------------------------------------------------
INVICTUS EA'YA YÜKSELTİN
Invictus EA, yapısal teknolojiyi kullanarak otomatik işlemler gerçekleştirir.
cTrader Mağazasında Invictus'u arayın.
--------------------------------------------------
TEKNİK NOTLAR
- Örtüşen gösterge
- Her zaman diliminde ve sembolde çalışır
- Yeniden çizim yok (tarihsel hesaplama)
- Performans için optimize edilmiştir
--------------------------------------------------
DESTEK
Ömür boyu güncellemeler dahildir.
DAHA FAZLA BİLGİ İÇİN - Aşağıdaki Geliştirici Profili'ne tıklayın.
Özet
The indicator identifies swings using configurable parameters such as swing depth and deviation mode (fixed pips or ATR-based), then computes volume distribution within the swing range without requiring manual range selection. Visual elements include colored markers for swing highs and lows, volume nodes, Fibonacci levels, and RSI values, all customizable in terms of color, opacity, and histogram positioning.
Key features include no repainting, configurable rows for volume profile resolution, extendable lines, and toggleable price labels. Use cases focus on identifying swing structures, volume distribution, key price levels, and confluences for trade entries, exits, and profit targets. The indicator is optimized for performance and provides lifetime updates.
























!["[Hamster-Coder] Bollinger Bands" logosu](https://cdn.ctrader.com/image/webp/21d8e5d6-fb11-4bac-b9ee-cd05c2b76804_30327)