
Volume Meter
Gösterge
2 satın almalar
Sürüm 1.0, Sep 2025
Windows, Mac
5.0
Değerlendirmeler: 1
Açıklama
📘 Bu Gösterge Ne Yapar
- Bir histogram olarak tik hacmini (çubuk başına fiyat değişikliği sayısı) gösterir.
- Forex'te, brokerlar nadiren gerçek işlem hacmi sağlar, bu yüzden tik hacmi vekil olarak kullanılır.
- Hisse senetleri/CFD'ler/vadeli işlemlerde gerçek hacim elde edebilirsiniz.
- Üzerine Hacmin Hareketli Ortalamasını (varsayılan 20 periyot) bindirir.
- Bu, mevcut çubuğun hacminin olağandışı derecede yüksek mi yoksa düşük mü olduğunu hızlıca görmek için bir “temel çizgi” görevi görür.
🎯 Onaylama İçin Nasıl Kullanılır
Gösterge tek başına bir sinyal üretici değildir. Bunun yerine, traderlar diğer stratejilerden gelen kurulumları onaylamak için kullanır:
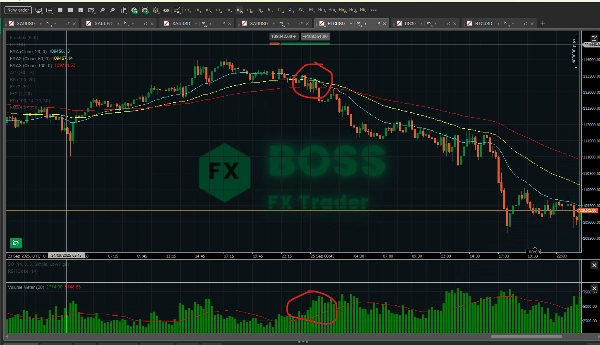
- Kırılma Onayı
-
- Fiyat direnç seviyesinin üzerine veya destek seviyesinin altına kırılırsa, kırılma mumunun hacminin hareketli ortalamasının üzerinde olup olmadığını kontrol edin.
- Yüksek hacim, hareketin arkasında daha fazla katılımcı olduğunu doğrular → kırılma daha güvenilirdir.
- Düşük hacimli kırılma = yanlış kırılma olasılığı daha yüksektir.
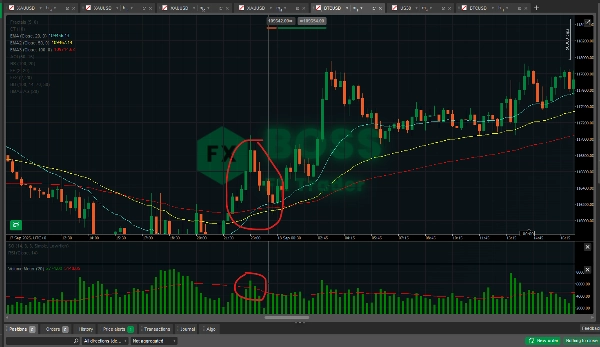
- Trend Devamı vs. Tükenme
-
- Güçlü bir trendde, geri çekilme mumları genellikle impuls mumlarına kıyasla daha düşük hacme sahiptir.
- Eğer geri çekilme düşük hacimde gerçekleşir ve sonraki hareket daha yüksek hacimle devam ederse → trend devamını doğrular.
- Trend itişinin devam ettiğini görüyorsanız ancak her itişte hacim düşüyorsa → olası tükenme, dönüşe hazırlanın.
- Dönüş Onayı
-
- Büyük dönüş mumları (pin barlar, engulfing mumlar, fraktallar) bir hacim sıçraması ile desteklenirse daha güçlüdür.
- Örnek: Destekte yüksek hacimli boğa pin barı = düşük hacimli aynı pin barından daha güçlü dönüş sinyali.
- Yanlış Sinyal Filtresi
-
- Ana sisteminiz al/sat sinyali veriyorsa ancak hacim zayıfsa (ortalamanın altında), o işlemi yapmaktan vazgeçebilirsiniz.
- Aşırı işlem yapmayı azaltmaya ve gürültüyü filtrelemeye yardımcı olur.
📊 Etkinlik
- Forex'te: Tik hacminin gerçek işlem hacmi ile güçlü bir korelasyona sahip olduğu gösterilmiştir (birçok çalışmada %70–90 korelasyon). Bu yüzden faydalıdır, ancak mükemmel değildir.
- Hisse Senetleri/Vadeli İşlemler/CFD'lerde: Gerçek hacim, gerçek işlem gören kontrat/hisse senetlerini ölçtüğünüz için bunu çok daha güçlü kılar.
- Onaylama Olarak: En iyi şekilde fiyat hareketi ve diğer göstergelerle birlikte (örneğin, EMA, RSI, fraktallar) kullanılır. Sadece hacme güvenmek risklidir.
- Güçlü Yönler: Kırılmaları doğrular, yanlış hareketleri filtreler, tükenmeyi tespit eder.
- Zayıf Yönler: Yönü kendi başına tahmin etmez — sadece bir kurulumunuz olduğunda güveni artırır.
✅ Pratik ipucu:
Göstergeyi bir filtre olarak kullanın, tetikleyici olarak değil. Örneğin:
- Bir EMA kesişimi görüyorsunuz (alış sinyali).
- Kontrol edin: Hacim hareketli ortalamasının üzerinde mi? Evet ise → işlemi yapın. Değilse → bekleyin.
Böylece sadece momentum piyasa katılımıyla desteklendiğinde işlem yaparsınız.
Özet
YZ özeti
Volume Meter is a trading indicator that displays tick volume—the number of price changes per bar—as a histogram. In Forex markets, where real traded volume data is often unavailable, tick volume serves as a proxy, while in stocks, CFDs, and futures, real volume data may be used. The indicator overlays a moving average of volume (default 20-period) to provide a baseline, helping traders identify whether current volume is unusually high or low.
This tool is designed to confirm trading setups rather than generate standalone signals. It assists in validating breakouts by checking if breakout candles have volume above their moving average, indicating stronger market participation. It also helps distinguish trend continuation from exhaustion by comparing volume levels during pullbacks and impulse moves. Additionally, it supports reversal confirmation by highlighting volume spikes on significant reversal candles and filters false signals by advising caution when volume is weak despite buy or sell signals from other systems.
Volume Meter is applicable across various markets including Forex, stocks, indices, commodities, and cryptocurrencies. Its effectiveness is enhanced when combined with price action and other indicators such as EMA or RSI. The indicator aids in improving trade decision confidence by integrating volume analysis as a confirmation and filtering tool.
Gösterge profili
Müşteri değerlendirmeleri
5.0
Değerlendirmeler: 1
5 | 100 % | |
4 | 0 % | |
3 | 0 % | |
2 | 0 % | |
1 | 0 % |
Müşteri değerlendirmeleri
October 1, 2025
the first 10 trades should stay boring, and the checklist becomes easier to follow.
Tartışma
SSS
BTCUSD
Forex
Breakout
Indices
EURUSD
Commodities
GBPUSD
NZDUSD
Prop
Supertrend
Crypto
Stocks
XAUUSD
NAS100
USDJPY
cTrader Store üzerinden erişilebilen işlem botları, göstergeler ve eklentiler gibi ürünler, üçüncü taraf sağlayıcılar tarafından sağlanır ve yalnızca bilgilendirme ve teknik erişim amaçlarıyla sunulur. cTrader Store bir broker değildir ve yatırım tavsiyesi, kişisel öneriler vermez veya gelecekteki performansı garanti etmez.


Fiyat
Başlangıç 29/05/2025
3.04M
İşlem hacmi
45.22K
Kazanılan pip
29
Satışlar
768
Ücretsiz yüklemeler