

Beschreibung
1️⃣ Was macht dieser Indikator?
Dieses Tool fasst die Kerzenrichtung über mehrere Zeitrahmen hinweg zusammen an einem Ort in Ihrem Chart.
Für jeden Zeitrahmen prüft es die zuletzt geschlossene Kerze und zeigt an:
StatusBedeutung
🟢 Bulle
Close > Open (Käufer haben die Kontrolle)
🔴 Bär
Close < Open (Verkäufer haben die Kontrolle)
⚪ Doji
Close ≈ Open (Unentschlossenheit)
Angezeigte Zeitrahmen:
- Täglich
- H4
- H1
- M30
- M15
- M5
Alle Status werden direkt im Chart angezeigt, sodass Sie die Zeitrahmen nicht wechseln müssen.
2️⃣ Warum dieses Tool mächtig ist
🔥 Löst ein häufiges Trader-Problem
Die meisten Trader fragen:
„Handle ich mit oder gegen den Trend des höheren Zeitrahmens?“
Dieser Indikator beantwortet das sofort.
Anstatt zu raten:
- Sie sehen die Trendübereinstimmung
- Sie vermeiden Gegen-Trend-Einstiege
- Sie verbessern Timing & Vertrauen
3️⃣ Wie der Indikator funktioniert
📌 Kerzenstatus-Logik
- Verwendet die zuletzt geschlossene Kerze (
Last(1)) - Kein Repainting
- Zuverlässige Bestätigung
📌 Multi-Timeframe-Daten
- Holt echte Kerzendaten aus jedem Zeitrahmen
- Unabhängig vom aktuellen Chart-Zeitrahmen
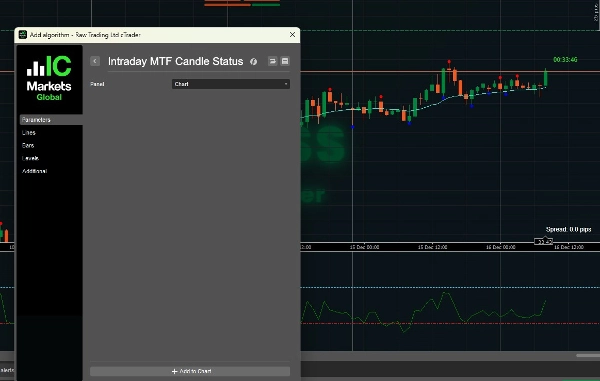
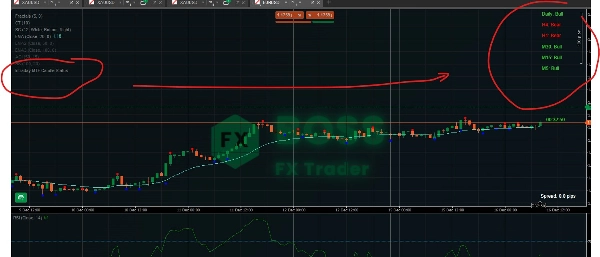
📌 Anzeige im Chart
- Zeichnet Textlabels im oben-rechten Bereich
- Farbkodiert für sofortige Lesbarkeit
- Wird bei jedem Tick aktualisiert
4️⃣ Wie man es effektiv nutzt (Trading-Szenarien)
🟢 Szenario 1: Trendbestätigung (Beste Anwendung)
✔ Regel:
Handeln Sie nur, wenn höhere und niedrigere Zeitrahmen übereinstimmen
Beispiel:
Täglich: Bulle
H4: Bulle
H1: Bulle
M15: Bulle
M5: Bulle
✅ Hochwahrscheinliches KAUF-Umfeld
Verwenden Sie:
- Pullbacks
- Ausbrüche
- Fortsetzungseinstiege
❌ Vermeiden Sie hier VERKÄUFE
🔴 Szenario 2: Gegen-Trend-Warnung
Täglich: Bulle
H4: Bulle
H1: Bär
M15: Bär
M5: Bär
⚠️ Der Markt befindet sich in einem Pullback, nicht in einer Umkehr.
Beste Maßnahmen:
- Warten Sie, bis M5/M15 wieder Bulle werden
- Vermeiden Sie das Hinterherlaufen von VERKÄUFEN
- Suchen Sie nach Kauf-Setups an Unterstützungen
⚪ Szenario 3: Unruhiger / Seitwärtsmarkt
Täglich: Bulle
H4: Doji
H1: Doji
M15: Bär
M5: Bulle
🚫 Bedingungen mit geringer Qualität
Empfohlen:
- Positionsgröße reduzieren
- Vermeiden Sie Ausbruchstrades
- Warten Sie auf klare Strukturen
5️⃣ Beispiel für eine Scalping-Strategie (M5-Einstiege)
🔹 Ideales Kaufsignal
- Täglich → Bulle
- H4 → Bulle
- H1 → Bulle
- M15 → Bulle
- M5 → Bär → wird Bulle
📍 Einstieg:
- Wenn M5 wieder auf Bulle wechselt
- Kombinieren mit:
-
- Unterstützung
- Fraktale
- EMA / VWAP
🔹 Ideales Verkaufssignal
Umgekehrte Logik:
- Höhere TFs → Bär
- Einstieg bei Abschluss des M5-Pullbacks
6️⃣ Beste Zeitrahmen-Kombinationen
Trading-StilFokus-Zeitrahmen
Scalping
H1 → M15 → M5
Intraday
H4 → H1 → M15
Swing
Täglich → H4 → H1
7️⃣ Was dieses Tool NICHT ist
🚫 Kein Einstiegssignal für sich allein
🚫 Kein Umkehrindikator
🚫 Kein Ersatz für Struktur / Preisaktion
✅ Es ist ein Bias- & Bestätigungstool
8️⃣ Beste Indikatoren zur Kombination
Sehr empfohlene Kombinationen:
- ✅ Fraktale (die Sie bereits verwenden)
- ✅ Marktstruktur (HH / LL)
- ✅ Unterstützung & Widerstand
- ✅ EMA 50 / EMA 200
- ✅ VWAP
9️⃣ Profi-Trading-Regeln mit diesem Tool
✔ Handeln nur in Richtung des HTF
✔ Verwenden Sie LTF nur für Einstiegszeitpunkt
✔ Ignorieren Sie Signale, wenn Daily & H4 nicht übereinstimmen
✔ Überhandeln Sie nicht bei gemischten Signalen
✔ Lassen Sie die Struktur den Kerzen-Bias bestätigen
🔟 Abschließende Zusammenfassung
IntradyMultiTimeframeCandleStatus = Markt-Bias-Dashboard
Es bietet Ihnen:
- Sofortige Trendklarheit
- Trades mit höherer Wahrscheinlichkeit
- Weniger emotionale Entscheidungen
- Sauberere Ausführung
Schauen Sie sich unser Produkt an.
Zusammenfassung
Kundenbewertungen
5 | 100 % | |
4 | 0 % | |
3 | 0 % | |
2 | 0 % | |
1 | 0 % |


