
Descrizione
Scopri le Zone di Trading ad Alta Probabilità con Advanced Supply Demand!
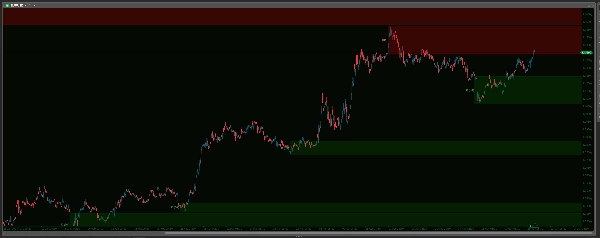
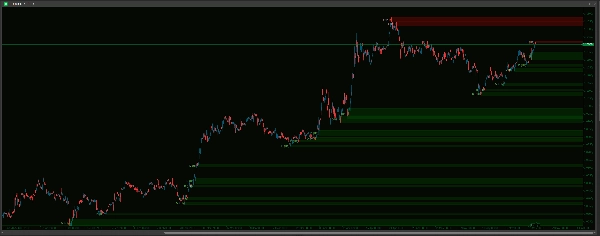
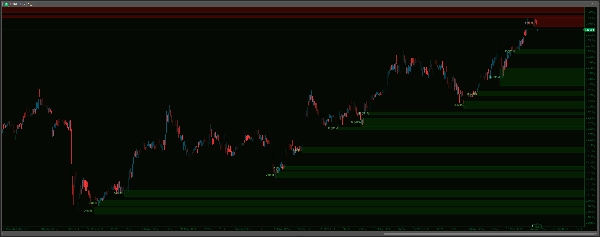
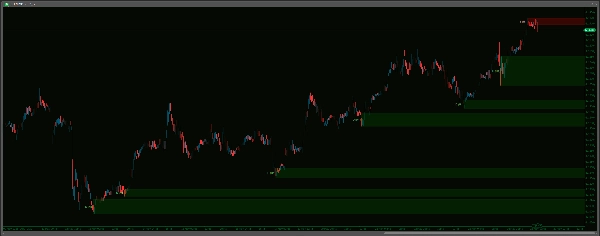
Sblocca una visione più chiara del mercato con l'indicatore Advanced Supply Demand Zones V2 . Questo potente strumento identifica e evidenzia automaticamente le aree cruciali di domanda e offerta sul tuo grafico, potenzialmente individuando dove potrebbero verificarsi reazioni significative del prezzo. Dotato di un sofisticato algoritmo di rilevamento dei punti di swing, capacità multi-timeframe (MTF) e ampie opzioni di personalizzazione, puoi adattare perfettamente l'indicatore al tuo stile di trading. Gestisci efficacemente le zone con opzioni per rimuovere aree rotte o coincidenti, applicare limiti temporali e mantenere il grafico pulito. Migliora la tua analisi con l'aspetto personalizzabile delle zone, etichette chiare dei timeframe e un robusto sistema di avvisi sonori – completo di un buffer dati live per prevenire rumori storici – assicurandoti di essere notificato degli avvicinamenti chiave del prezzo alle tue zone definite. Porta la tua analisi tecnica al livello successivo e prendi decisioni di trading più informate!
-------------------
Miglioramenti rispetto alla V1:
Advanced Supply Demand V2 offre miglioramenti significativi per un'esperienza di trading più precisa, intuitiva ed efficace:
- Avvisi più intelligenti e silenziosi – Niente più rumore storico!
-
- Gli avvisi si attivano sull'azione del prezzo in tempo reale dopo il caricamento, eliminando fastidiosi avvisi storici! Inoltre, scegli i tuoi suoni da un semplice menu a tendina, un grande passo avanti rispetto alla digitazione dei nomi dei file. Hai anche la funzione Max Alerts Per Zone per evitare spam di notifiche.
- Configurazione senza sforzo – Impostazioni semplificate!
-
- Goditi un setup molto più intuitivo con menu a tendina per la maggior parte delle opzioni (Timeframe, scelte Sì/No, Stili Linea, File Sonori). Fallo bene la prima volta, ogni volta!
- Logica e gestione delle zone più chiare – Meno confusione, più chiarezza!
-
- Snellito in un approccio più diretto e azionabile. La V2 usa regole chiare per rimuovere zone rotte, gestisce intelligentemente le zone sovrapposte (coincidenti) per mantenere il grafico ordinato, e offre una semplice scadenza basata sul tempo per le zone vecchie, più un'opzione per limitare il numero di zone visualizzate.
- Controllo visivo superiore – Il tuo grafico, a modo tuo!
-
- Ottieni controllo granulare con impostazioni di aspetto separate (Colore, Spessore, Stile) per le zone di Offerta e Domanda. Personalizza i visual in modo preciso secondo le tue preferenze e rendi le zone interattive sul tuo grafico!
- Definizione della zona più flessibile!
-
- Ora include l'opzione
IncludeBarBody, che ti permette di scegliere tra zone solo con wick o zone che includono il corpo della candela per una prospettiva di mercato potenzialmente più ampia e diversa.
- Ora include l'opzione
-------------------
Guida alle Impostazioni: Advanced Supply Demand Zones
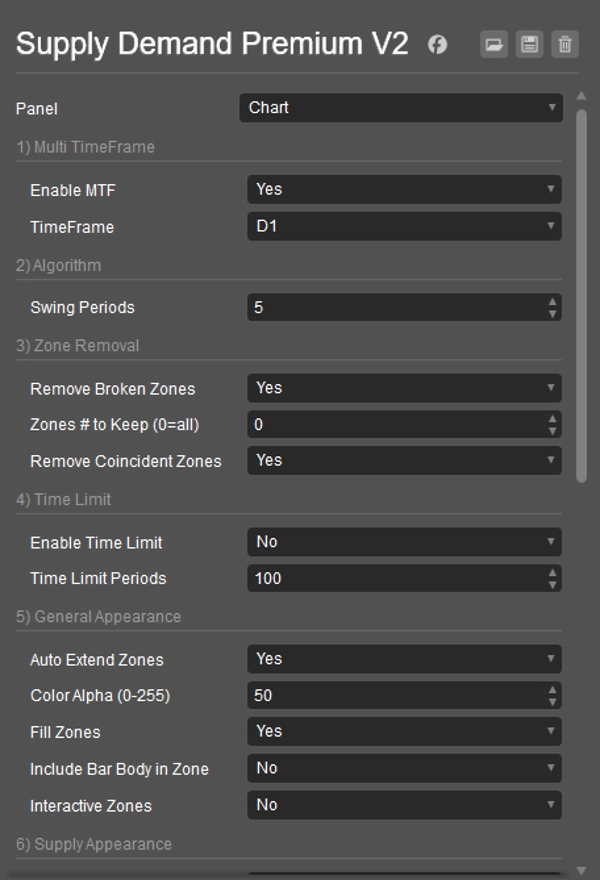
1) Multi TimeFrame
- Abilita MTF: Sì per vedere le zone di un timeframe diverso sul tuo grafico attuale. No per le zone del grafico corrente.
- TimeFrame: Se MTF è Sì, scegli qui l'altro timeframe (es. zone H4 su un grafico M15).
2) Algoritmo
- Periodi di Swing: Imposta quante barre definiscono una forte inversione di mercato (punto di swing) per creare le zone. Numeri più alti significano zone più forti (e solitamente meno).
3) Rimozione delle Zone
- Rimuovi Zone Rotte: Sì per eliminare automaticamente le zone una volta che il prezzo le rompe chiaramente.
- Numero di Zone da Mantenere (0=tutte): Limita quante delle zone più recenti sono mostrate.
0mostra tutte. - Rimuovi Zone Coincidenti: Sì per rimuovere automaticamente la zona più vecchia se due zone si sovrappongono molto, mantenendo il grafico più pulito.
4) Limite di Tempo
- Abilita Limite di Tempo: Sì per far scomparire automaticamente le zone molto vecchie.
- Periodi del Limite di Tempo: Se il limite di tempo è abilitato, le zone più vecchie di questo numero di barre saranno rimosse.
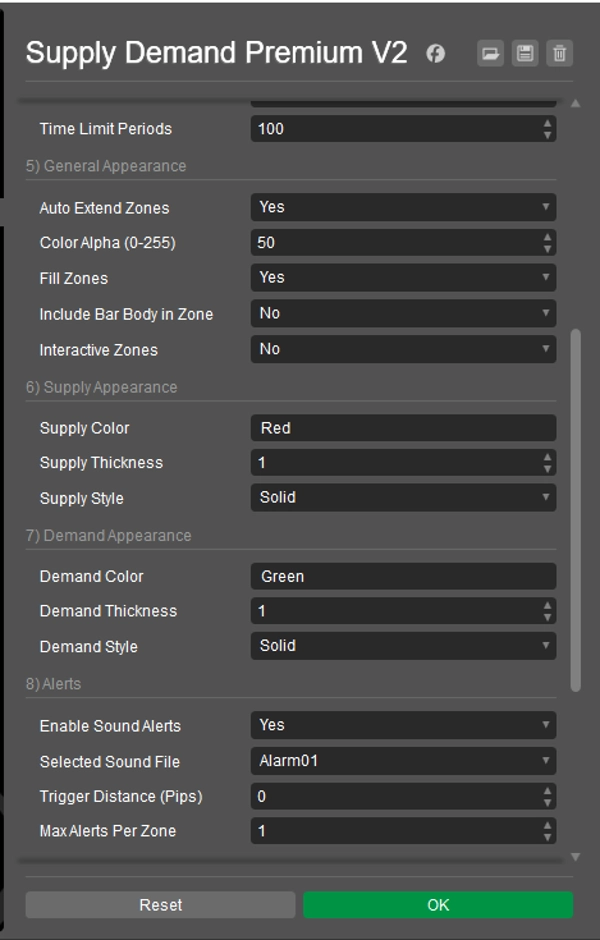
5) Aspetto Generale
- Estendi Automaticamente le Zone: Sì per disegnare le zone molto in avanti nel futuro. No per zone più corte.
- Alpha Colore (0-255): Imposta quanto trasparenti sono i colori delle zone (0 = invisibile, 255 = solido).
- Riempi le Zone: Sì per riempire le zone con colore. No per solo contorni.
- Includi Corpo della Barra nella Zona: Sì per usare il corpo della candela (più le ombre) per la larghezza della zona. No per usare solo le ombre.
- Zone Interattive: Sì per permetterti di cliccare e spostare le zone sul grafico.
6) Aspetto Offerta
- Colore Offerta: Imposta il colore per le zone di offerta (superiori). (es. "Rosso", "#FF0000")
- Spessore Offerta: Imposta lo spessore della linea di bordo per le zone di offerta.
- Stile Offerta: Imposta lo stile della linea di bordo (Solido, Puntini, ecc.) per le zone di offerta.
7) Aspetto Domanda
- Colore Domanda: Imposta il colore per le zone di domanda (inferiori). (es. "Verde", "#00FF00")
- Spessore Domanda: Imposta lo spessore della linea di bordo per le zone di domanda.
- Stile Domanda: Imposta lo stile della linea di bordo (Solido, Puntini, ecc.) per le zone di domanda.
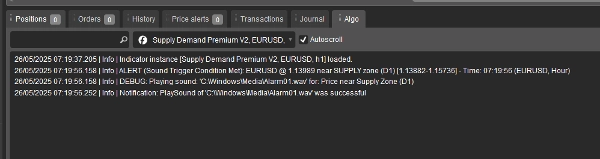
8) Avvisi Nota: Per evitare avvisi su dati vecchi o all'avvio, gli avvisi sonori diventeranno attivi solo dopo che sono avvenuti 20 tick di prezzo live dall'avvio dell'indicatore sul tuo grafico.
- Abilita Avvisi Sonori: Sì per attivare le notifiche sonore quando il prezzo si avvicina a una zona.
- File Sonoro Selezionato: Scegli il suono che vuoi sentire per gli avvisi. I suoni di sistema (come "Alarm01") cercano di essere riprodotti da
C:\Windows\Media\; assicurati che il file esista e che cTrader possa accedervi. "cTraderDefaultAlert" usa un suono standard di cTrader. "Nessuno" non riproduce alcun suono. - Distanza di Attivazione (Pips): Quanto vicino (in pips) il prezzo deve arrivare al bordo di una zona per attivare un avviso.
- Max Avvisi Per Zona: Limita quante volte un avviso suonerà per la stessa zona.
9) Etichetta TimeFrame
- Mostra Etichetta TimeFrame: Sì per visualizzare il timeframe (es. H1, D1) su ogni zona.
- Colore Etichetta Offerta: Colore del testo per le etichette delle zone di offerta.
- Colore Etichetta Domanda: Colore del testo per le etichette delle zone di domanda.
- Offset X Etichetta (Barre): Regola la posizione orizzontale dell'etichetta dall'inizio della zona.
- Dimensione Font Etichetta: Imposta la dimensione del testo dell'etichetta.
10) Altro
- Pulizia all'Avvio: Sì per rimuovere i disegni vecchi di questo indicatore quando cTrader si avvia o l'indicatore viene aggiunto a un grafico.
- Riconosci di Nuovo le Zone Rimosse: (Questa impostazione ha un impatto diretto limitato nella versione attuale. Le zone vengono rivalutate a ogni tick; se i criteri per una zona sono nuovamente soddisfatti e non è considerata rotta, riapparirà indipendentemente dal fatto che questa impostazione sia Sì o No).
----------------------------
Sentiti libero di dare un'occhiata ai miei altri indicatori:
https://ctrader.com/products/1181
https://ctrader.com/products/1182
https://ctrader.com/products/1180
https://ctrader.com/products/1015
https://ctrader.com/products/555
https://ctrader.com/products/553
https://ctrader.com/products/554
https://ctrader.com/products/552
https://ctrader.com/products/557
https://ctrader.com/products/845
https://ctrader.com/products/848
https://ctrader.com/products/847
https://ctrader.com/products/846
https://ctrader.com/products/551
https://ctrader.com/products/574
https://ctrader.com/products/573
https://ctrader.com/products/556
https://ctrader.com/products/558
https://ctrader.com/products/559
https://ctrader.com/products/560
Riepilogo
Recensioni dei clienti
5 | 0 % | |
4 | 100 % | |
3 | 0 % | |
2 | 0 % | |
1 | 0 % |


