
LT_Ind_VWAP
Indicatore
2 acquisti
Versione 1.0, Oct 2025
Windows, Mac
4.5
Recensioni: 2
Descrizione
Nota: Testato solo su cTrader Windows.
LT_Ind_VWAP è un indicatore VWAP ancorato pratico per cTrader.
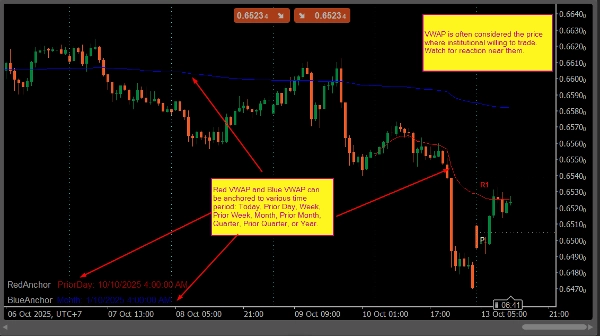
Traccia due linee VWAP (Rossa e Blu) che possono essere ancorate ciascuna a un periodo selezionato, come Oggi, Giorno Precedente, Settimana, Settimana Precedente, Mese, Mese Precedente, Trimestre, Trimestre Precedente o Anno.
L'indicatore si ricalcola automaticamente all'inizio di un nuovo giorno e mostra l'ancora attiva e la data direttamente sul grafico. È progettato per i trader che utilizzano i livelli VWAP per monitorare il valore equo, la direzione del trend o le aree di ritorno alla media.
Caratteristiche Principali
- Due linee VWAP con ancore indipendenti
- Ancore supportate: Oggi, Giorno Precedente, Settimana, Settimana Precedente, Mese, Mese Precedente, Trimestre, Trimestre Precedente, Anno
- Ricalcolo automatico al cambio di sessione
- Informazioni sull'ancora visualizzate sul grafico
- Configurazione semplice, uso minimo delle risorse
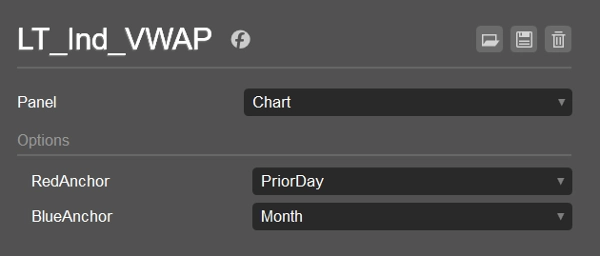
Impostazioni Predefinite
- VWAP Rossa: Giorno Precedente
- VWAP Blu: Mese
Casi d'Uso
- Confrontare il prezzo intraday con il VWAP del giorno precedente
- Monitorare il VWAP mensile o trimestrale per la direzione del movimento
- Trovare la confluenza tra livelli VWAP a breve e lungo termine
Riepilogo
Riepilogo AI
LT_Ind_VWAP is an anchored VWAP (Volume Weighted Average Price) indicator designed for the cTrader platform (Windows version). It displays two independent VWAP lines—red and blue—each anchored to selectable time periods including Today, Prior Day, Week, Prior Week, Month, Prior Month, Quarter, Prior Quarter, or Year. The indicator automatically recalculates at the start of a new trading session and shows the active anchor and date on the chart for easy reference. Its primary use cases include comparing intraday prices with prior-day VWAP, monitoring monthly or quarterly VWAP for swing trading bias, and identifying confluence between short- and long-term VWAP levels. The default settings anchor the red VWAP to the prior day and the blue VWAP to the current month. LT_Ind_VWAP offers a simple setup with minimal resource consumption, making it suitable for traders who rely on VWAP levels to assess fair value, trend direction, or mean-reversion zones across various markets such as Forex, indices, commodities, cryptocurrencies, and stocks.
Profilo indicatore
Recensioni dei clienti
4.5
Recensioni: 2
5 | 50 % | |
4 | 50 % | |
3 | 0 % | |
2 | 0 % | |
1 | 0 % |
Recensioni dei clienti
October 26, 2025
Discussioni
Domande frequenti
Prop
Forex
Indices
Commodities
Crypto
Stocks
VWAP
I prodotti disponibili tramite cTrader Store, inclusi bot di trading, indicatori e plugin, sono forniti da sviluppatori terzi e resi disponibili esclusivamente a scopo informativo e di accesso tecnico. cTrader Store non è un broker e non fornisce consulenze in materia di investimento, raccomandazioni individualizzate o garanzie di risultati futuri.


Prezzo
Da 25/09/2024
34
Vendite