
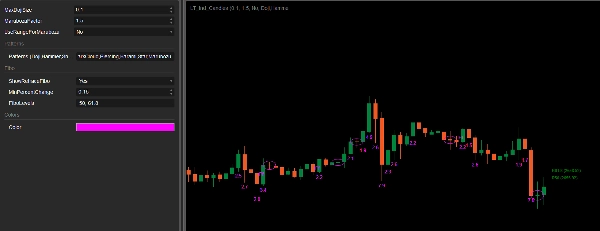
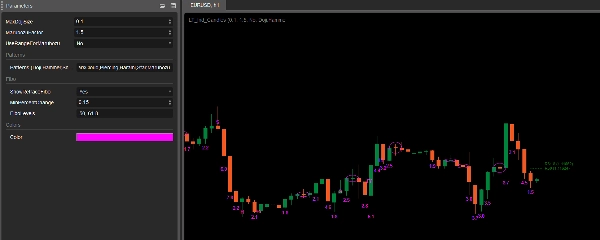
LT_Ind_Candles
Wskaźnik
4 zakupy
Wersja 1.0, Sep 2024
Windows, Mac
4.0
Opinie: 1
Opis
Uwaga: Testowano tylko na cTrader Windows.
Wzory pojedynczych świec:
- Doji
- Młot
- Spadająca gwiazda
Wzory 2 świec:
- Engulf
- DarkCloud
- Piercing
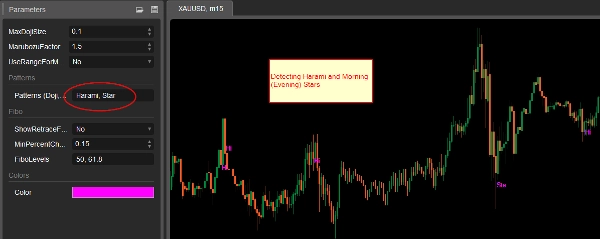
- Harami
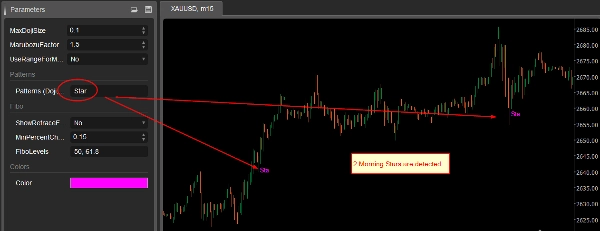
Wzory 3 świec:
- Poranne gwiazdy
- Wieczorne gwiazdy
Marubozu:
Jeśli wybrano, oznaczana jest wielkość świec z dużym korpusem. Przeczytaj opisy ustawień dotyczące wielkości.
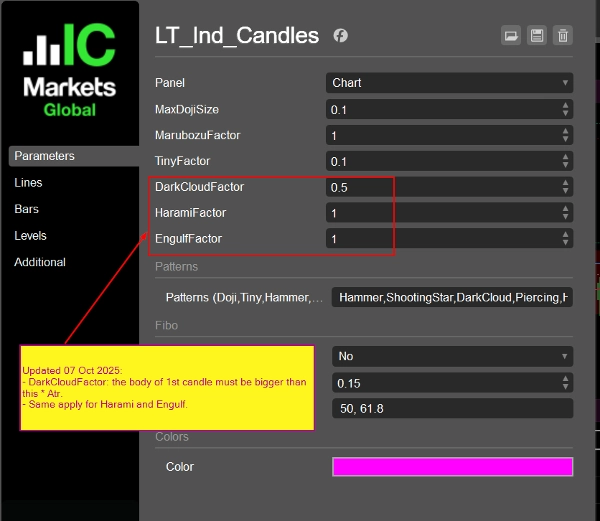
Ustawienia:
(Aktualizacja 07 paź 2025:
- Użyj Atr (14 okresów, prosta średnia krocząca) zamiast MedianBarBody
- Dodano ustawienia dla DarkCloud (i Piercing), Harami, współczynników Engulf
)
- MaxDojiSize: Maksymalny stosunek między korpusem świecy a zakresem świecy, aby uznać ją za Doji (domyślnie 0,1).
- Współczynnik Marubozu: Korpus bieżącej świecy musi być > MarubozuFactor * Atr, aby uznać ją za dużą świecę (Marubozu). Knoty nie są tu brane pod uwagę.
- Użyj zakresu dla Marubozu: Użyj BarRange (High - Low) zamiast BarBody (Open - Close).MathAbs() podczas sprawdzania Marubozu.
- Wzory: wpisz wzory, które chcesz wykrywać, oddzielone przecinkami. Akceptowane wartości to: Doji,Młot,SpadającaGwiazda,Engulf,DarkCloud,Piercing,Harami,Gwiazda,Marubozu. Zauważ, że jeśli wybierzesz "Gwiazda", wykrywane będą zarówno Poranne, jak i Wieczorne gwiazdy.
- Pokaż poziomy Fibo korekty: Poziomy Fibo pomagające kontrolować ryzyko. Gdy występują 2 kolejne świece z wyższym maksimum i wyższym minimum, wyświetlane są określone poziomy Fibo obliczone na podstawie tych 2 świec. Możesz utrzymać pozycję do momentu osiągnięcia tych poziomów, aby kontrolować ryzyko. Poziomy są konfigurowalne. Po przeciwnej stronie jest to samo (niższe maksimum i niższe minimum).
- Minimalna zmiana procentowa: 2 świece użyte do poziomów Fibo muszą wykazywać zmianę ceny większą niż ten procent.
- Poziomy Fibo: wpisz swoje poziomy oddzielone przecinkami.
- Kolor: kolor oznaczenia świecy.
Podsumowanie
Profil wskaźnika
Opinie klientów
4.0
Opinie: 1
5 | 0 % | |
4 | 100 % | |
3 | 0 % | |
2 | 0 % | |
1 | 0 % |
Dyskusja
Częste pytania
Forex
Signal
Indices
Commodities
Crypto
Stocks
ATR
Produkty dostępne za pośrednictwem cTrader Store, w tym boty handlowe, wskaźniki i wtyczki, dostarczane są przez deweloperów zewnętrznych i udostępniane wyłącznie w celach informacyjnych oraz w celu zapewnienia dostępu technicznego. cTrader Store nie jest brokerem i nie zapewnia doradztwa inwestycyjnego, nie udziela spersonalizowanych rekomendacji ani nie gwarantuje przyszłych wyników.


Cena
Od 25/09/2024
34
Sprzedaż