
Opis
Uwaga: Testowano tylko na cTrader Windows.
LT_Ind_Pivot to potężny, konfigurowalny wskaźnik Pivot Point dla cTrader, który pomaga wizualizować kluczowe poziomy rynkowe i struktury sesji na wielu interwałach czasowych.
Automatycznie oblicza i rysuje Pivot (P), Support (S1–S5), Resistance (R1–R5) oraz CPR (TC/BC) na podstawie wybranego interwału kotwicy — od H1, H4, H8, H12, D1, W1 do Month1.
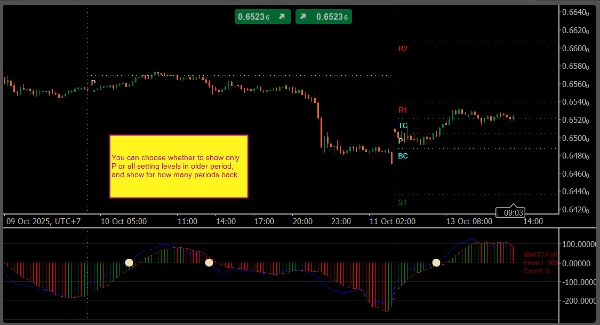
Wskaźnik rysuje również pionowe linie separatora dla każdego okresu kotwicy, zarówno na głównym wykresie, jak i na panelach wskaźników, co ułatwia rozróżnienie granic sesji lub okresów.
Możesz dokładnie określić, które poziomy mają być wyświetlane, używając elastycznej notacji takiej jak:
P, S1, R1– standardowe poziomyPS1,S1S2,R1R2itd. – poziomy pośrednie między pivotami a głównymi wsparciami/oporamiTC,BC– Centralny Zakres Pivot (CPR)
Kontrolki wyświetlania pozwalają ustawić, ile historycznych pivotów ma być widocznych, czy pokazywać etykiety tekstowe/cenowe oraz jak kolorować lub stylizować każdy poziom.
Główne funkcje
- Kotwice pivot: H1, H4, H8, H12, D1, W1, Month1
- Niestandardowa składnia poziomów:
P, Sx, Rx, PS1, S1S2, R1R2, TC, BC - Pionowe separatory okresów na wykresie i panelach wskaźników
- Opcja wyświetlania tekstu, cen i starych poziomów pivot
- Pełna personalizacja kolorów i stylów linii
- Lekki i odpowiedni do handlu na żywo
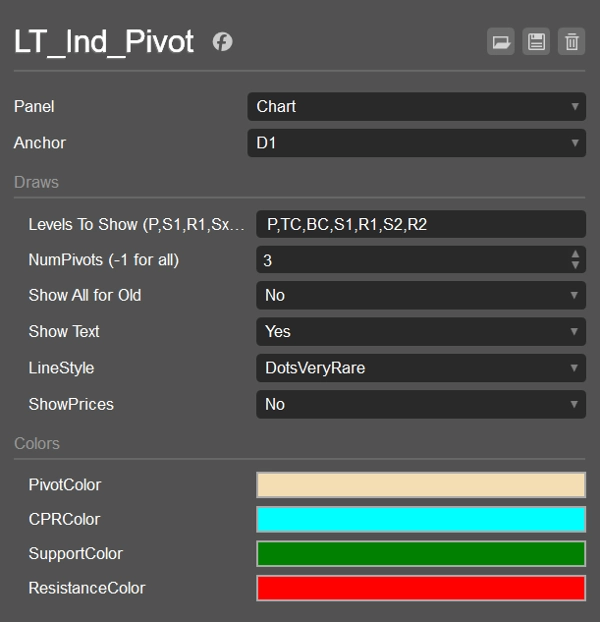
Domyślne ustawienia
- Kotwica: D1
- Pokaż poziomy:
P,S1,R1 - Liczba widocznych pivotów wstecz: 1
- Pokaż wszystko dla starych pivotów: false
- Pokaż tekst: true
- Pokaż ceny: false
- Styl linii: Solid
- Kolory: Pivot = Wheat, CPR = Cyan, Support = Green, Resistance = Red
Przypadki użycia
- Oznaczanie intraday i swing stref wsparcia/oporu
- Śledzenie CPR i poziomów pośrednich dla setupów wybicia lub powrotu do średniej
- Używanie separatorów okresów do analizy struktury sesja po sesji
- Łączenie z wskaźnikami VWAP lub Swing dla większej konfluencji
Podsumowanie
Opinie klientów
5 | 0 % | |
4 | 100 % | |
3 | 0 % | |
2 | 0 % | |
1 | 0 % |


