
Descrizione
✅ Rileva punti di svolta ad alta e bassa probabilità utilizzando una logica pivot avanzata
✅ Motori Depth, Deviation & Backstep completamente personalizzabili
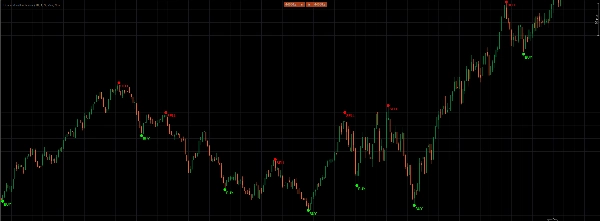
✅ Traccia automaticamente etichette chiare di ACQUISTO e VENDITA sul grafico
✅ Opzionali marcatori pivot e evidenziazioni della barra corrente per maggiore chiarezza
✅ Progettato per catturare inversioni precoci con precisione e sicurezza
Scatena un trading di precisione con il Buy & Sell Indicator: un potente motore di segnali basato sui pivot che individua punti di svolta alti e bassi utilizzando impostazioni personalizzabili di profondità, deviazione e backstep. Configura il tuo DepthEngine, DeviationEngine e BackstepEngine per affinare la sensibilità, quindi lascia che l'indicatore tracci automaticamente chiare etichette “BUY” e “SELL”—complete di marcatori pivot opzionali e della barra corrente nei tuoi colori preferiti—così non perderai mai più un'inversione di tendenza! Fai trading in modo più intelligente, non più difficile.
Riepilogo
Recensioni dei clienti
5 | 33 % | |
4 | 67 % | |
3 | 0 % | |
2 | 0 % | |
1 | 0 % |


