
Descrizione
Il Linear Regression Oscillator (LRO) è un indicatore tecnico basato sull'analisi di regressione lineare, comunemente utilizzato nei mercati finanziari per valutare il momentum e la direzione delle tendenze dei prezzi. Misura la distanza tra il prezzo corrente e il valore previsto da una linea di regressione lineare, che è essenzialmente la linea di miglior adattamento su un periodo specificato. Ecco una spiegazione di come funziona e dei suoi componenti:
Componenti chiave del Linear Regression Oscillator
- Linea di Regressione Lineare (Linea di Miglior Adattamento): Questa linea rappresenta il movimento previsto del prezzo su un certo periodo ed è calcolata utilizzando tecniche di regressione lineare. La pendenza della linea indica la direzione della tendenza: una pendenza positiva suggerisce un trend rialzista, mentre una pendenza negativa indica un trend ribassista.
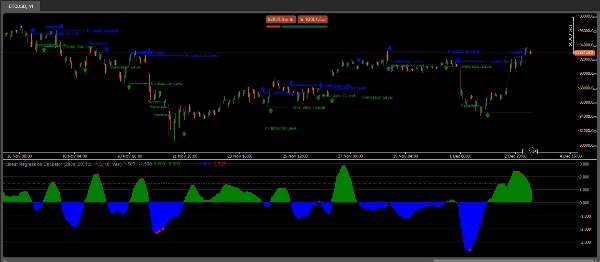
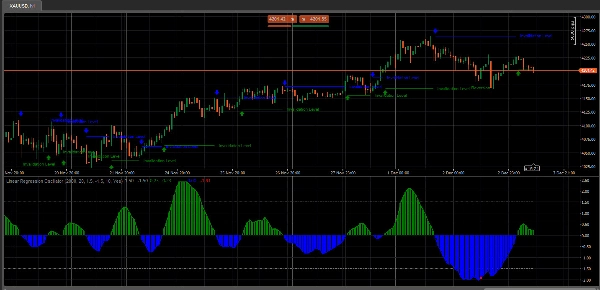
- Valori dell'Oscillatore: Il valore dell'oscillatore è calcolato misurando la deviazione tra il prezzo corrente e la linea di regressione lineare. Questa deviazione viene tracciata come valore dell'oscillatore, oscillando tipicamente intorno a una linea zero.
- Linea Zero: La linea zero in un grafico LRO funge da linea di base. Quando il valore dell'oscillatore attraversa la linea zero verso l'alto, suggerisce un momentum rialzista, mentre un attraversamento verso il basso indica un momentum ribassista.
- Impostazioni e Periodi: L'impostazione del periodo definisce il numero di barre o punti dati considerati per il calcolo della linea di regressione lineare. I trader regolano questa impostazione per adattarsi a strategie di trading a breve o lungo termine, a seconda del loro intervallo di analisi preferito.
Come i trader utilizzano il Linear Regression Oscillator
- Identificazione delle tendenze: L'LRO aiuta i trader a vedere se la tendenza del prezzo corrente ha momentum mostrando la distanza relativa tra il prezzo e la sua linea prevista (di regressione).
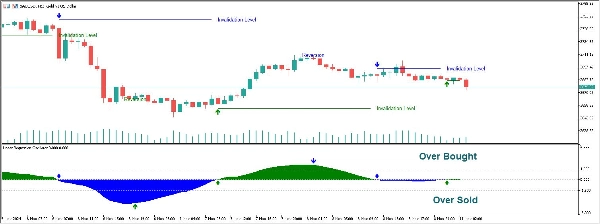
- Livelli di ipercomprato/ipervenduto: Valori estremi nell'oscillatore possono indicare condizioni di ipercomprato o ipervenduto, suggerendo una possibile inversione o la necessità di aggiustare le posizioni.
- Segnali di divergenza: Quando i movimenti del prezzo e l'indicatore LRO divergono, può segnalare un indebolimento del momentum o una possibile inversione.
Consigli per l'interpretazione
- Attraversamento della linea zero: Un attraversamento sopra lo zero può indicare l'emergere di un trend rialzista, mentre un attraversamento sotto lo zero suggerisce un trend ribassista.
- Regolazione dei periodi: Periodi più brevi rendono l'LRO più sensibile, catturando movimenti rapidi dei prezzi ma aumentando il rumore. Periodi più lunghi smussano le fluttuazioni, adatti per identificare tendenze a lungo termine.
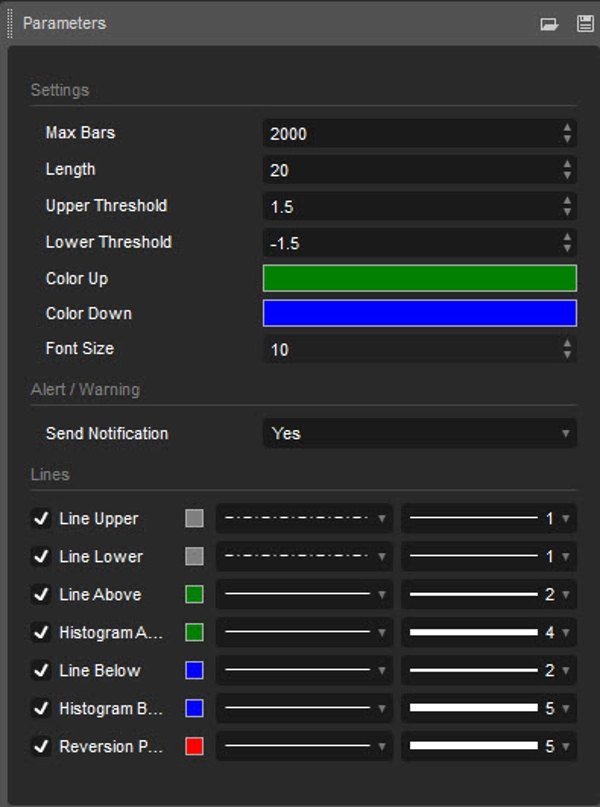
Note sull'uso:
- Lunghezza: Determina il periodo su cui viene calcolata la regressione lineare
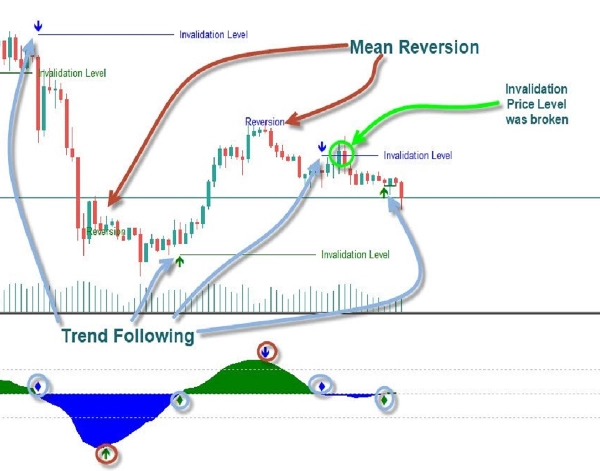
- Soglia superiore/inferiore: Definiscono i limiti superiore e inferiore per identificare condizioni di ipercomprato e ipervenduto. Valori al di fuori di queste soglie suggeriscono potenziali inversioni.
Il Linear Regression Oscillator è apprezzato per combinare l'analisi statistica con i principi di seguire la tendenza, rendendolo uno strumento versatile sia per i trader di momentum che per quelli di tendenza. È particolarmente utile nei mercati in trend, dove aiuta a identificare continuazioni o inversioni di tendenza basate sulle deviazioni dalla linea di tendenza di regressione.
Riepilogo
Recensioni dei clienti
5 | 0 % | |
4 | 100 % | |
3 | 0 % | |
2 | 0 % | |
1 | 0 % |


