
Weekly Daily Levels
Indicatore
2 acquisti
Versione 1.0, Aug 2025
Windows, Mac
5.0
Recensioni: 2
Descrizione
Ti affidi ai prezzi OHLC giornalieri e settimanali e ai prezzi a punto medio nella tua strategia di trading? Sei stanco di segnarli manualmente ogni volta che effettui un'operazione?
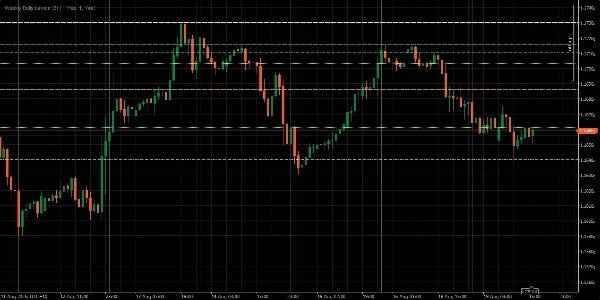
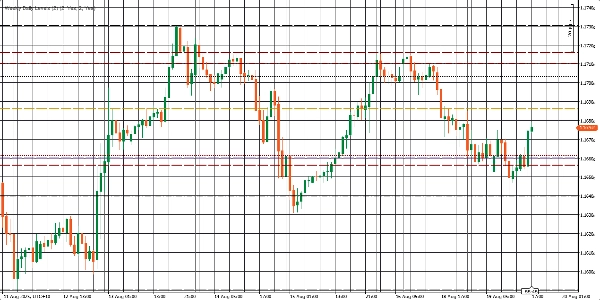
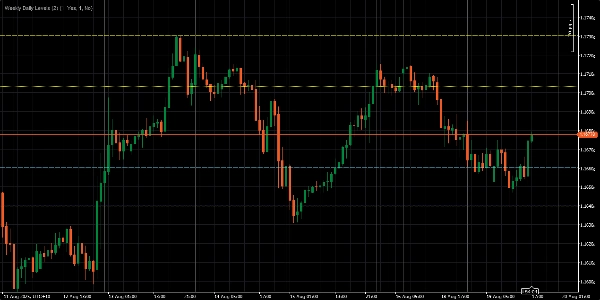
Il Weekly Daily Levels Indicator fa il lavoro pesante per te. Traccia automaticamente i prezzi di apertura, massimo, minimo, chiusura (OHLC) e a punto medio del giorno precedente e della settimana precedente direttamente sul tuo grafico. Questo significa che puoi concentrarti sull'esecuzione della tua strategia mentre l'indicatore si occupa dei dettagli—rendendo il tuo trading più semplice, veloce e molto più efficiente.
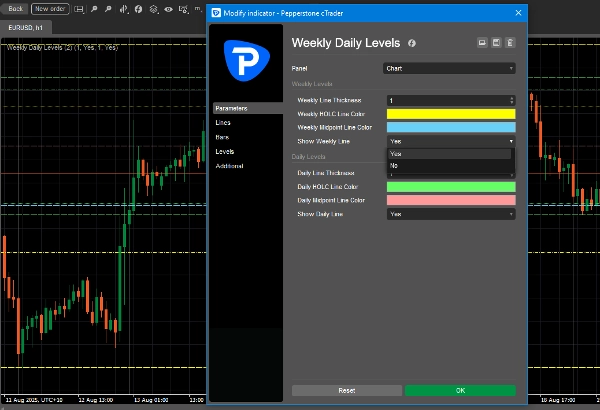
Caratteristiche principali:
- Visualizza istantaneamente i prezzi OHLC giornalieri e settimanali e i prezzi a punto medio.
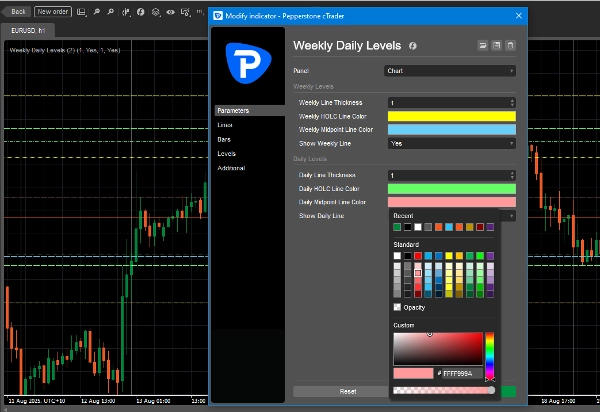
- Personalizza i colori delle linee per adattarli allo stile del tuo grafico.
- Attiva o disattiva i livelli giornalieri o settimanali con un solo clic.
- Regola lo spessore delle linee per una migliore visibilità.
Riepilogo
Riepilogo AI
The Weekly Daily Levels indicator automatically plots the previous day’s and previous week’s open, high, low, close (OHLC) prices along with their mid-points directly on trading charts. It provides instant visual reference to these key price levels, helping traders incorporate daily and weekly price data into their strategies without manual marking. Users can customize line colors and thickness to fit their chart style and toggle daily or weekly levels on or off with a single click. This indicator streamlines the process of tracking important historical price levels for improved trading efficiency.
Profilo indicatore
Recensioni dei clienti
5.0
Recensioni: 2
5 | 100 % | |
4 | 0 % | |
3 | 0 % | |
2 | 0 % | |
1 | 0 % |
Recensioni dei clienti
August 28, 2025
Not bad if the rules are already clear. Two timeframes give more context.
August 21, 2025
the good surprise is the setup needs less second guessing, and It works better with a written plan.
Discussioni
Domande frequenti
I prodotti disponibili tramite cTrader Store, inclusi bot di trading, indicatori e plugin, sono forniti da sviluppatori terzi e resi disponibili esclusivamente a scopo informativo e di accesso tecnico. cTrader Store non è un broker e non fornisce consulenze in materia di investimento, raccomandazioni individualizzate o garanzie di risultati futuri.


Prezzo
Da 19/04/2025
2
Vendite