
Descrizione
Indicatori Pinescriptlabs Store: Pinescriptlabs Store cBots : (cBot) Gold & BTC BreakoutSession Pivots(nuovo)
Proiezione della Liquidità del Prezzo ZigZag
Algoritmo Intelligente di Trailing (nuovo)
Mappa di Liquidazione della Leva
Previsione Basata su Linreg & ATR
Supporto SmartTrend &
Resistenza
Linee
Sistema di Breakout del Canale
Analisi
Dinamica
della Struttura di Mercato
dei
Punti
di Inversione
Regressione
Lineare
Fibonacci
Multi-timeframe
Proiezione del Flusso di Mercato
Gradiente di Tendenza Dinamico
Tracciatore
di Bias
a Candele
Multi-Livello
Tracciatore di Estremità Zig-Zag
Linea
di Supporto e
Resistenza
di Tendenza
Automatica
Tutti i
Livelli di
Supporto e
Resistenza
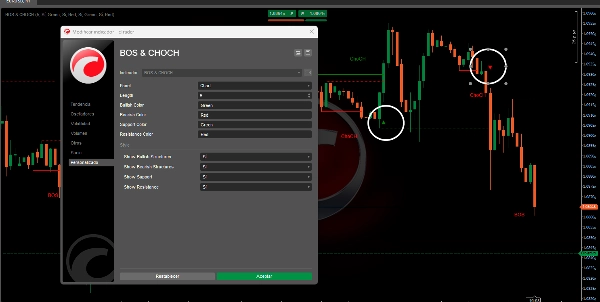
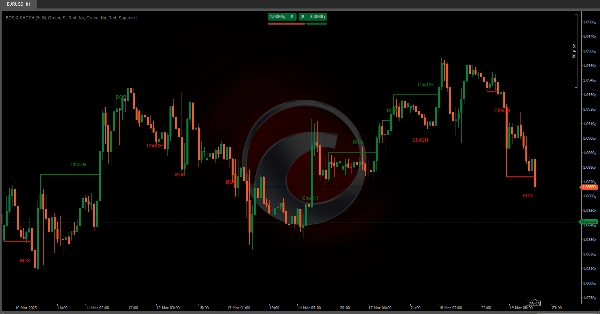
L'algoritmo è progettato per identificare schemi strutturali di mercato , in particolare i concetti di Cambiamento di Carattere (ChoCH) 🔄 e Rottura di Struttura (BoS) 💥. Di seguito, spiegherò in dettaglio cosa fa questo algoritmo, il suo scopo e come identifica questi due concetti.
Cosa Fa l'Algoritmo?
L'algoritmo utilizza frattali (massimi e minimi locali) per determinare se il prezzo ha cambiato il suo comportamento o ha rotto una struttura precedentemente stabilita. Di seguito le funzionalità principali:
Rilevamento dei Frattali 📊
- Un frattale rialzista si verifica quando c'è un massimo locale dove le candele ai lati sono più basse. 📈
- Un frattale ribassista si verifica quando c'è un minimo locale dove le candele ai lati sono più alte. 📉
- Questi frattali fungono da punti di riferimento per identificare i cambiamenti nella struttura del mercato.
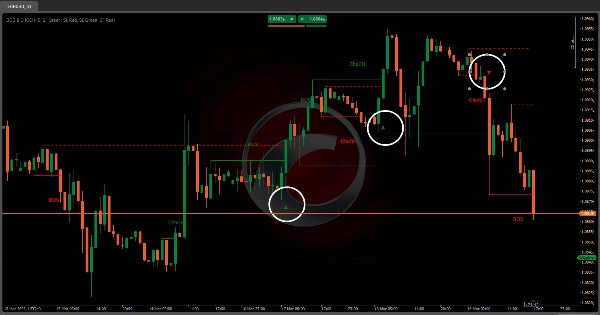
Identificazione di ChoCH (Cambiamento di Carattere) 🔄
- Un ChoCH rialzista si verifica quando il prezzo supera un frattale rialzista senza formare prima una struttura ribassista completa.
- Un ChoCH ribassista si verifica quando il prezzo scende sotto un frattale ribassista senza formare prima una struttura rialzista completa.
- Questo indica che il mercato ha cambiato il suo carattere (da trend a consolidamento o viceversa).
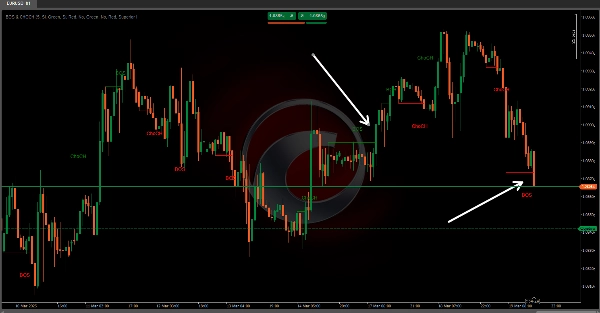
Identificazione di BoS (Rottura di Struttura) 💥
- Un BoS rialzista si verifica quando il prezzo supera un frattale rialzista dopo aver formato prima una struttura ribassista completa.
- Un BoS ribassista si verifica quando il prezzo scende sotto un frattale ribassista dopo aver formato prima una struttura rialzista completa.
- Questo indica che il mercato ha rotto una struttura precedentemente stabilita, che può essere un punto importante di ingresso o uscita.
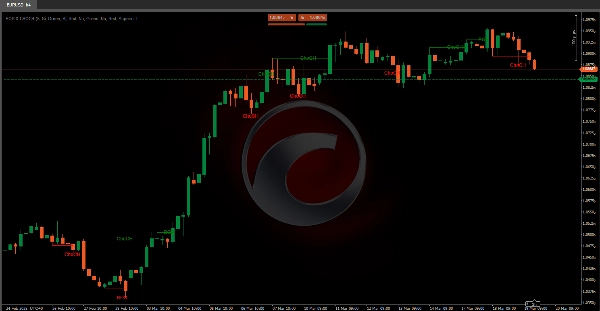
Visualizzazione di Supporto e Resistenza 🛡️
- L'algoritmo può tracciare linee di supporto e resistenza basate sui frattali rilevati.
- Controlla anche se queste linee vengono rotte, segnando i punti di breakout con icone visive.
Questo algoritmo fornisce ai trader preziose informazioni sul comportamento del mercato identificando chiaramente i cambiamenti strutturali chiave e le potenziali opportunità di breakout. Sfruttando i segnali ChoCH 🔄 e BoS 💥, i trader possono prendere decisioni più informate su ingressi, uscite e dinamiche complessive del mercato.
Riepilogo
Key functionalities include:
- **Fractal Detection:** Identifies bullish fractals (local highs with lower candles on both sides) and bearish fractals (local lows with higher candles on both sides).
- **Change of Character (ChoCH):** Signals when the market changes its behavior, such as shifting from trend to consolidation, by surpassing fractals without forming a complete opposite structure.
- **Break of Structure (BoS):** Indicates when the market breaks a previously established structure, marking potential entry or exit points.
- **Support and Resistance Visualization:** Draws support and resistance lines based on fractals and marks breakout points with visual icons.
This indicator aids traders in understanding market dynamics by clearly highlighting structural changes and breakout opportunities, supporting more informed trading decisions.
Recensioni dei clienti
5 | 100 % | |
4 | 0 % | |
3 | 0 % | |
2 | 0 % | |
1 | 0 % |


