
Descripción
Indicadores de Pinescriptlabs Store: Pinescriptlabs Store cBots : (cBot) Gold & BTC BreakoutSession Pivots(nuevo)
Proyección de Liquidez de Precio ZigZag
Algoritmo Inteligente de Seguimiento (nuevo)
Mapa de Liquidación de Apalancamiento
Predicción Basada en Linreg y ATR
Soporte y Tendencia Inteligente
Resistencia
Líneas
Sesiones de Brecha de Valor Justo
Análisis
Dinámico de
Estructura de Mercado
de
Puntos
de Giro
Regresión
Lineal
Fibonacci
Multitemporal
Brecha de Valor Justo de Momentum
Proyección de Flujo de Mercado
Gradiente de Tendencia Dinámico
Rastreador de
Sesgo de Vela
Multinivel
Rastreador de Extremos Zig-Zag
Soporte
y Resistencia
Automáticos
de Tendencia
Líneas
Todos
los Soportes y
Resistencias
Niveles
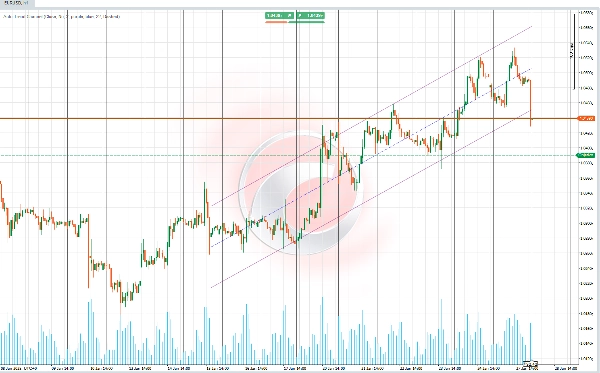
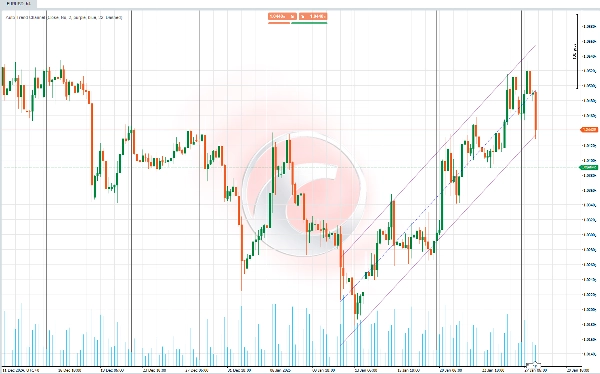
📊 Canal de Tendencia Automático 📊
Este indicador traza un canal de tendencia basado en el cálculo de regresión lineal y la desviación estándar de los datos de precios (logarítmicos) para un período seleccionado automáticamente. 📈 El período se determina utilizando el coeficiente de correlación de Pearson (RRR), eligiendo el de mayor valor absoluto. 🧮
✨ Funcionalidad Principal ✨
La funcionalidad principal es calcular un canal de tendencia que se adapta automáticamente a la longitud de período más representativa, utilizando estadísticas avanzadas para definir soporte, resistencia y la línea central de tendencia.
El canal incluye:
1️⃣ Una línea base que representa la tendencia lineal calculada.
2️⃣ Líneas superior e inferior que definen las bandas del canal a una distancia proporcional a la desviación estándar.
🚀 Características y Cálculos 🚀
🔎 Cálculo del Período Óptimo
- El indicador evalúa múltiples períodos de datos (cortos o largos, según la configuración) para encontrar el que tenga la correlación más precisa con el comportamiento del mercado.
- Se utiliza la correlación de Pearson como métrica clave para identificar el período con la relación más fuerte entre el precio histórico y la línea de tendencia generada.
📐 Regresión Lineal y Proyección de Precio
- Para cada período evaluado, se calcula una línea de regresión basada en el logaritmo natural de los precios para estabilizar variaciones extremas.
- Los componentes clave del cálculo incluyen:
-
- Pendiente: Representa la tasa de cambio del precio.
- Intercepto: El punto de inicio de la línea proyectada.
- Media: Establece una línea base de referencia.
📊 Desviación Estándar y Límites del Canal
- Se calcula la desviación estándar de los precios en relación con la línea de regresión.
- La banda superior (resistencia) y la banda inferior (soporte) se derivan ajustando la línea central con un multiplicador de desviación estándar configurable por el usuario.
🌈 Visualización del Canal de Tendencia
- El canal está compuesto por tres elementos principales:
-
- Línea Central: Muestra la tendencia principal basada en la línea de regresión.
- Línea Superior: Representa el límite superior del canal (resistencia), ajustado por la desviación estándar.
- Línea Inferior: Representa el límite inferior del canal (soporte), ajustado por la desviación estándar.
- Los usuarios pueden personalizar los colores, transparencia y estilos de línea del canal para una mejor claridad visual.
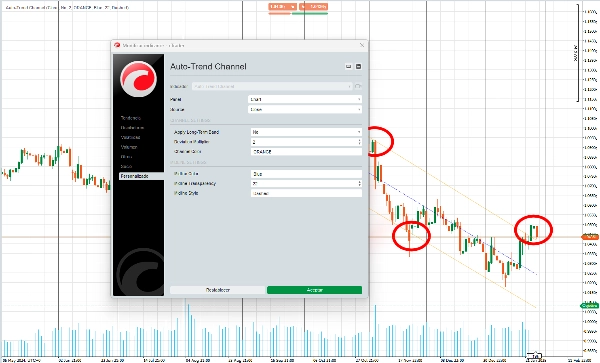
🎛️ Adaptabilidad y Configuración
- Los usuarios pueden personalizar varios aspectos del indicador, tales como:
-
- Los colores de las líneas y del canal.
- Si enfocarse en períodos largos (tendencias macro) o períodos cortos (tendencias micro).
- Esta adaptabilidad asegura que el indicador se ajuste a diferentes estilos de trading y preferencias visuales.
🔍 Uso :
1️⃣ Identificación de Tendencia
- La línea central del canal ayuda a determinar si el mercado está en una tendencia alcista, tendencia bajista o tendencia lateral.
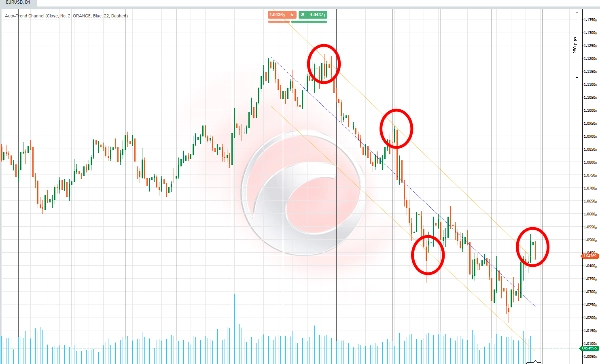
2️⃣ Soporte y Resistencia Dinámicos
- Las líneas superior e inferior del canal actúan como zonas potenciales donde el precio puede revertir o consolidar.
3️⃣ Detección de Consolidación y Ruptura
- Los precios que se mantienen dentro del canal sugieren consolidación, mientras que una ruptura indica un cambio de tendencia o un movimiento fuerte del precio.
4️⃣ Ajuste a Diferentes Estilos de Trading
- Los períodos largos son útiles para identificar tendencias generales y tomar decisiones estratégicas en marcos temporales más amplios.
- Los períodos cortos permiten a los traders capturar movimientos más rápidos y responder a cambios inmediatos del mercado.
Resumen
Key features include:
- Optimal period selection by evaluating multiple data intervals to find the strongest correlation between historical prices and the trend line.
- Calculation of slope, intercept, and mean for precise linear regression and price projection.
- Visualization of the trend channel with customizable colors, transparency, and line styles.
- Adaptability for different trading styles by allowing focus on long-term (macro) or short-term (micro) trends.
Use cases:
- Identifying market trends (uptrend, downtrend, sideways) via the central trend line.
- Detecting dynamic support and resistance zones where price may reverse or consolidate.
- Recognizing consolidation phases within the channel and breakouts signaling trend changes or strong price movements.
- Adjusting analysis to suit strategic decisions or faster market responses depending on selected period length.
This indicator supports various markets including cryptocurrencies (BTCUSD), commodities (XAUUSD), and others, providing a statistical approach to trend and channel analysis.
Valoraciones de clientes
5 | 60 % | |
4 | 20 % | |
3 | 20 % | |
2 | 0 % | |
1 | 0 % |


