
Descripción
QX SmartStructure (QX SS)
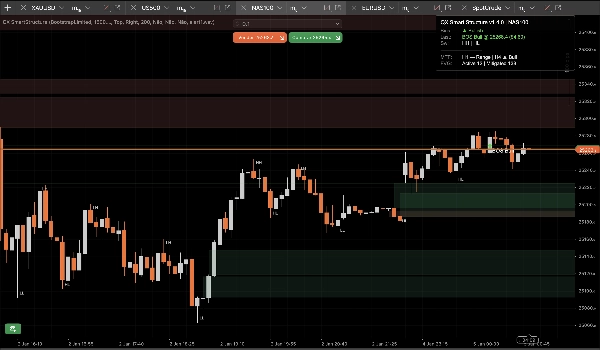
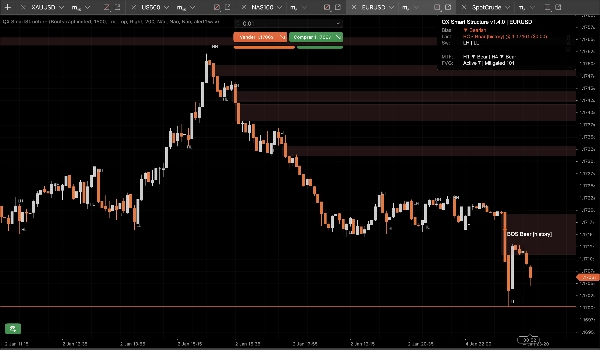
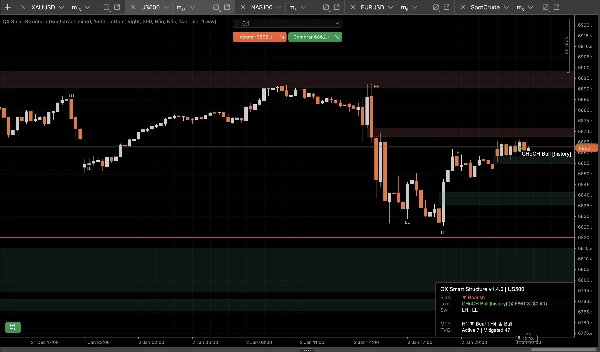
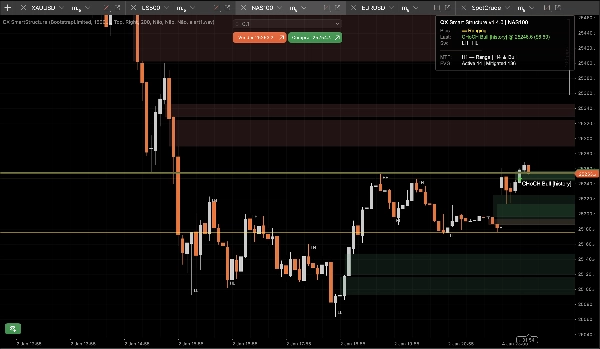
QX SmartStructure (QX SS) es una superposición ligera de SMC con borde derecho duro para cTrader. Muestra la estructura actual, rupturas BOS/CHoCH, zonas FVG filtradas y autogestionadas, y un panel compacto de sesgo MTF H1/H4 para que dejes de cambiar de marcos temporales.
Solo herramienta de visualización. No realiza operaciones.
Lo que muestra
1) Estructura de mercado limpia (borde derecho duro)
- Etiquetas de oscilación: HH / HL / LH / LL
- Niveles clave: último máximo de oscilación confirmado y último mínimo de oscilación confirmado
- Eventos de ruptura: BOS / CHoCH con fuerza (Fuerte vs Débil)
- Modos de visualización:
-
- SoloActivo (mínimo)
- OscilacionesRecientes (contexto controlado)
2) Zonas FVG que se mantienen bajo control
- Rectángulos FVG alcistas y bajistas
- Tamaño mínimo de FVG (pasos) el filtro elimina micro-huecos automáticamente
- Regla de mitigación del 50% (basada en mechas): una zona se mitiga cuando el precio alcanza su nivel medio
- Ciclo de vida:
-
- Ocultar automáticamente mitigadas = ACTIVADO para el gráfico más limpio
- DESACTIVADO mantiene las zonas mitigadas como contexto “fantasma” (opacidad baja)
- Los límites estrictos evitan el spam de objetos en sesiones largas (almacenados/dibujados/extensión a la derecha)
3) Panel de sesgo MTF (H1 / H4)
Un panel compacto muestra:
- Sesgo del marco temporal actual: Alcista / Bajista / Rango / Desconocido
- Último evento: BOS/CHoCH, dirección, fuerza
- Instantáneas opcionales: sesgo H1 y sesgo H4
4) Alertas sonoras opcionales
Alertas solo sonoras para rupturas, con:
- Alerta opcional en rupturas débiles
- Nombre de archivo de sonido personalizado
La ventaja de StepSize (FX, Oro, Índices)
La mayoría de las herramientas de estructura fallan cuando cambias de símbolo porque asumen que “pips” significan lo mismo en todas partes.
QX SS usa StepSize como unidad universal: TickSize → PipSize → Digits fallback
Convierte cualquier distancia a pasos
pasos = distancia_precio ÷ TickSize
Ejemplos (tamaños de tick comunes):
- TickSize EURUSD 0.00001: 1 pip (0.00010) = 10 pasos
- TickSize XAUUSD 0.01: $0.10 = 10 pasos, $1.00 = 100 pasos
- Los índices varían según el bróker:
Dónde encontrar TickSize
- En cTrader Automate: Symbol.TickSize (QX SS lo lee de forma segura)
- En la interfaz de la plataforma: panel de especificación del símbolo (información del símbolo en Market Watch)
Tamaño mínimo recomendado de FVG (pasos)
Estos son rangos prácticos iniciales, no una verdad universal. La volatilidad y la sesión importan.
M15 (flujo de trabajo predeterminado)
- EURUSD: 20–40 pasos (≈ 2–4 pips si TickSize = 0.00001)
- XAUUSD: 30–120 pasos (≈ $0.30–$1.20 si TickSize = 0.01)
- US500 / NAS100: elige un movimiento significativo en puntos, luego convierte:
M5 (sí, cambia)
M5 imprime más micro-huecos. Si mantienes el mismo MinFVGSteps filtrarás demasiado.
Ajuste típico: reduce MinFVGSteps en ~30–50% respecto a tu valor de M15, luego reajusta.
“Rango” no es un error!
El sesgo se vuelve Rango cuando los máximos/mínimos recientes no se alinean claramente como HH+HL o LH+LL.
En mercados laterales, una herramienta que se mantiene “Alcista” para siempre está mintiendo. QX SS es conservador por diseño.
Preajustes (puntos de partida)
Preajuste A: “M15 Balanceado” (predeterminado recomendado)
- Fuerza de oscilación (M15=7): 7
- Tipo de ruptura: Cierre
- Solo confirmado: verdadero
- Modo de visualización: OscilacionesRecientes
- Conteo de oscilaciones recientes: 30
- Tamaño mínimo de FVG (pasos): EURUSD 25 | XAUUSD 60 | Índices 15 (luego ajusta)
- Ocultar automáticamente mitigadas: verdadero
- Máximo FVG dibujado: 30
- Extender barras a la derecha: 50
- Mostrar MTF H1: verdadero
- Mostrar MTF H4: verdadero
Preajuste B: “M15 Gráfico Limpio”
- Modo de visualización: SoloActivo
- Mostrar etiquetas de oscilación: falso
- Ocultar automáticamente mitigadas: verdadero
- Máximo FVG dibujado: 15–20
- (Mantén el resto del Preajuste A)
Preajuste C: “Contexto Scalp M5”
- Fuerza de oscilación: 5–6
- Tipo de ruptura: Cualquiera
- Solo confirmado: verdadero (comienza estricto)
- Mostrar rupturas débiles: falso
- Tamaño mínimo de FVG (pasos): ~50–70% de tu valor M15
- Conteo de oscilaciones recientes: 20–30
- Extender barras a la derecha: 30–50
Integración cBot / automatización (lo que expone QX SS)
QX SmartStructure expone 3 series internas para cBots:
- BiasSeries: 1 alcista, -1 bajista, 0 de otro modo
- BreakSignalSeries: 1 ruptura alcista, -1 ruptura bajista, 0 de otro modo
- BreakLevelSeries: nivel de precio en la barra del evento, NaN de otro modo (centinela limpio)
Estabilidad y rendimiento (v1.5.1+)
Diseñado para configuraciones multi-gráfico y sesiones largas:
- Procesa solo en barras cerradas nuevas
- Actualizaciones de UI limitadas por UI Throttle (ms) para mantener bajo el uso de CPU
- Conteo controlado de objetos y límites de poda evitan spam en el gráfico
- Detecta recargas “duras” reales de forma segura (recarga de marco temporal/símbolo/historial) y reconstruye el estado sin deriva
Nuevas opciones de seguridad (v1.5.1+)
Invalidar en salto de gap (predeterminado ACTIVADO)
Si el precio hace un gap y salta sobre una zona FVG sin tocarla (apertura de fin de semana/noticias), la zona se marca Invalidada por Gap en lugar de permanecer activa.
Esto evita que las zonas obsoletas permanezcan en el gráfico tras aperturas violentas.
Borrado completo de series al reconstruir (predeterminado DESACTIVADO)
En reconstrucción dura, opcionalmente borra todo el historial de las series de salida expuestas para máxima consistencia en backtest/exportación.
Mantén DESACTIVADO para mejor rendimiento en historiales grandes. Actívalo SOLO para flujos de trabajo de backtesting profundo que necesitan integridad histórica completa.
Valores predeterminados recomendados
- Invalidar en salto de gap: Sí (ACTIVADO)
- Borrado completo de series al reconstruir: No (DESACTIVADO)
Aviso legal
Esta herramienta es solo para visualización y apoyo en la toma de decisiones. Operar conlleva riesgos. Siempre usa tu propia gestión de riesgos.
Resumen
It automatically detects and manages Fair Value Gap (FVG) zones, filtering out micro-gaps based on a configurable minimum size measured in steps, a universal unit derived from the symbol’s TickSize. The indicator applies a 50% mitigation rule to mark zones as mitigated when price reaches their midpoint, with options to auto-hide or display mitigated zones as ghosted.
QX SmartStructure includes a compact multi-timeframe (MTF) bias panel showing current timeframe bias (Bullish, Bearish, Ranging, or Unknown) and recent break events for H1 and H4 timeframes. Optional sound alerts notify users of break events, including weak breaks.
The tool supports various markets such as Forex, commodities (e.g., gold), indices, and cryptocurrencies by adapting to symbol-specific TickSize values. It exposes internal data series for integration with cBots and is optimized for performance with controlled object counts and throttled updates. The indicator does not place trades and is intended for decision support only.
Valoraciones de clientes
5 | 100 % | |
4 | 0 % | |
3 | 0 % | |
2 | 0 % | |
1 | 0 % |


