
QX MatrixHybrid
Indicador
Versión 1.0, Feb 2026
Windows, Mac
4.6
Valoraciones: 3
Descripción
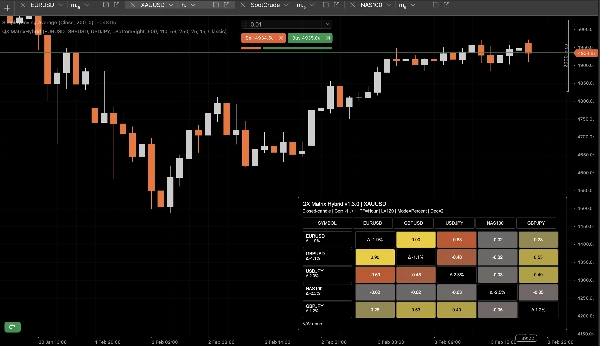
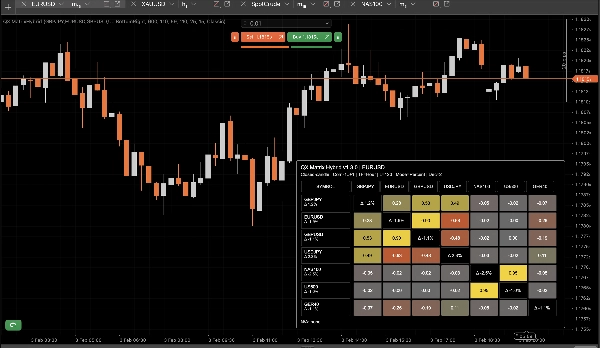
QX Matrix Hybrid es un indicador visual que muestra una matriz de correlación multi-activos como un panel limpio de mapa de calor. Te ayuda a identificar instantáneamente qué instrumentos se mueven juntos, cuáles se mueven inversamente y dónde podrías estar duplicando exposición inadvertidamente en los mercados.
Características clave
- Matriz de correlación (-1 a +1) usando correlación de Pearson entre símbolos.
- Modo de retorno:
-
- Retornos porcentuales
- Retornos logarítmicos
- Fuerza (Δ%) por símbolo: muestra el rendimiento de cada símbolo durante la ventana de análisis (en las etiquetas de fila y opcionalmente en la diagonal).
- Contraste automático de texto: el color del texto se adapta a la luminancia del fondo para mejorar la legibilidad.
- Temas + paleta personalizada: múltiples preajustes más controles completos de selección de color personalizados.
- Diseño flexible del panel: anclaje en esquina, ancho, tamaño de celdas, márgenes, control de altura de fila.
- Pie de página inteligente: lista símbolos faltantes/no disponibles con truncamiento configurable.
Rendimiento y lógica de actualización
Diseñado para mantenerse responsivo incluso con múltiples símbolos:
- Caché por símbolo de objetos Symbol y Bars para evitar llamadas repetitivas a la API.
- Invalidación automática de caché cuando CSV de símbolos o TimeFrame cambian.
- Modo solo vela cerrada para minimizar la carga de CPU (actualizaciones en nuevas barras cerradas).
- Opcional Limitador de actualización (ms) para modo en vivo.
Cómo usarlo
- +1.00: co-movimiento positivo fuerte (alta redundancia).
- 0.00: relación baja (potencial diversificación).
- -1.00: relación inversa fuerte (posible cobertura).
Usa la matriz para reducir la superposición correlacionada, encontrar pares de cobertura y entender los “clústeres” del mercado a través de FX, índices, metales, criptomonedas, etc.
Parámetros (nivel alto)
- CSV de símbolos, TimeFrame, Ventana de análisis
- Modo de retorno (Porcentaje/Log), Decimales, Decimales automáticos en Log
- Solo vela cerrada, Limitador de actualización
- Mostrar fuerza (Δ%), Mostrar pie de página, Máximo de faltantes en pie de página
- Diseño del panel (esquina, ancho, tamaños de celda, margen)
- Colores / Tema (incluyendo paleta personalizada)
Notas
- Solo visualización. No se colocan órdenes.
- Los símbolos pueden mostrar N/A si no están disponibles en tu broker/servidor o si no hay suficiente historial para el marco temporal/ventana de análisis seleccionados.
Resumen
Resumen de IA
QX MatrixHybrid is a real-time visual indicator that presents a multi-asset correlation matrix as a heatmap panel. It displays Pearson correlation coefficients ranging from -1 to +1 between up to 12 selected symbols, helping users identify strong positive correlations, inverse relationships, and low correlations for diversification or hedging purposes. The indicator supports multiple return modes, including percent and log returns, and tracks each symbol’s performance over a configurable lookback period, showing strength as percentage change.
The interface offers full customization with multiple color themes and a custom palette, adjustable panel layout options (such as docking, cell size, and margins), and automatic text contrast for readability. It includes a smart footer that lists missing or unavailable symbols with configurable truncation.
Performance optimizations include per-symbol caching to reduce API calls, automatic cache invalidation on symbol or timeframe changes, and a "Closed Candle Only" mode to minimize CPU load by updating only on new closed bars. An optional update throttle controls live update frequency.
QX MatrixHybrid is designed for use across various markets including forex, indices, commodities, metals, and cryptocurrencies. It is a visualization tool only and does not place orders. Symbols may show as unavailable if data is insufficient or missing.
Perfil del indicador
Valoraciones de clientes
4.6
Valoraciones: 3
5 | 67 % | |
4 | 33 % | |
3 | 0 % | |
2 | 0 % | |
1 | 0 % |
Valoraciones de clientes
February 12, 2026
The part that matters is bad ideas get easier to avoid, and 20 signals is a fair first sample.
February 9, 2026
Two sessions say more than one clean chart, and weak ideas are easier to skip.
February 5, 2026
Ngl, weak ideas are easier to skip and that is enough to keep testing it. Price action still has to agree.
Conversación
Preguntas frecuentes
Signal
Indices
Commodities
GBPUSD
RSI
Bollinger
Fibonacci
Scalping
AI
XAUUSD
NAS100
MACD
BTCUSD
Forex
Breakout
EURUSD
NZDUSD
Martingale
Prop
ZigZag
Supertrend
Fair Value Gap
SMC
Crypto
Grid
Stocks
ATR
USDJPY
VWAP
Los productos disponibles a través de cTrader Store, incluidos bots, indicadores y plugins para operar, son proporcionados por desarrolladores de terceros y están disponibles únicamente con fines informativos y de acceso técnico. cTrader Store no es un bróker, por lo que no proporciona asesoramiento de inversión, recomendaciones personales ni ninguna garantía de rentabilidad futura.


Precio
41.97M
Volumen operado
208.53K
Pips ganados
13
Ventas
354
Instalaciones gratis