
UTBotAlerts
Indicador
1 compras
Versión 1.0, Jun 2026
Windows, Mac
5.0
Valoraciones: 1
Descripción
El UT Bot es un indicador de análisis técnico popular y altamente personalizable para identificar posibles reversiones de tendencia y cambios de impulso. Está diseñado para simplificar las decisiones de trading al trazar señales claras de entrada y salida directamente en el gráfico de precios.
Características y Componentes Clave
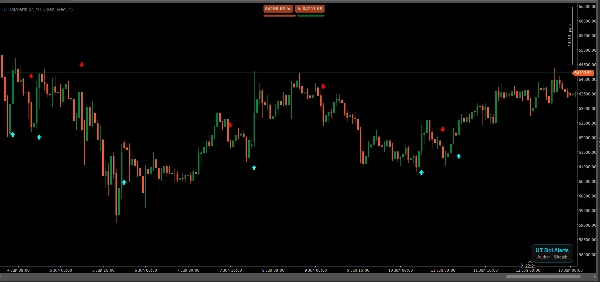
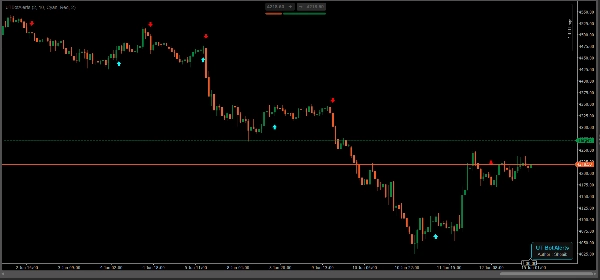
- Señales de Compra y Venta: El indicador traza flechas verdes "BUY" (Subir) y flechas rojas "SELL" (Bajar) para resaltar posibles cambios de tendencia. Como se ve en el gráfico, una señal de venta aparece al inicio de una caída del mercado, mientras que una señal de compra se activa cuando el impulso cambia hacia arriba.
- Seguimiento de Tendencias: Ayuda a los traders a distinguir visualmente entre una tendencia bajista (acción de precio bajista moviéndose por debajo de una línea base) y una tendencia alcista (acción de precio alcista subiendo).
- Integración con Velas Japonesas: Las señales se superponen perfectamente en gráficos estándar de velas japonesas, facilitando ver los niveles exactos de precio donde el bot se activa.
- Sensibilidad Basada en la Volatilidad: El UT Bot generalmente se basa en una combinación del Average True Range (ATR) y un mecanismo de stop móvil, permitiendo a los traders ajustar su sensibilidad para filtrar el ruido del mercado o capturar tendencias a más largo plazo.
Resumen
Resumen de IA
UTBotAlerts is a technical analysis indicator designed to identify potential trend reversals and momentum shifts in financial markets. It visually signals buy and sell opportunities by plotting green "BUY" arrows and red "SELL" arrows directly on candlestick price charts, aiding traders in recognizing entry and exit points. The indicator distinguishes between uptrends and downtrends by tracking price action relative to a baseline, helping users interpret market direction clearly. UTBotAlerts incorporates volatility-based sensitivity adjustments using the Average True Range (ATR) combined with a trailing stop mechanism, allowing customization to filter market noise or capture longer-term trends. This indicator supports trend analysis and overlays seamlessly on standard price charts, enhancing decision-making through clear, actionable signals.
Perfil del indicador
Categoría del indicador
Tendencia
Tipo de resultado
Señales
Requisitos de datos
Únicamente barras
Señales admitidas
Fuerza de la tendencia
Valoraciones de clientes
5.0
Valoraciones: 1
5 | 100 % | |
4 | 0 % | |
3 | 0 % | |
2 | 0 % | |
1 | 0 % |
Valoraciones de clientes
June 29, 2026
UT Bot Alerts is a lightweight and stable implementation of the classic ATR-based trend reversal indicator. It provides clean BUY/SELL signals, adapts well to changing volatility conditions and works consistently across Forex and Gold markets. Its simplicity and reliability make it particularly useful as a trend filter or confirmation tool.
Conversación
Preguntas frecuentes
Supertrend
Volume
ATR
Los productos disponibles a través de cTrader Store, incluidos bots, indicadores y plugins para operar, son proporcionados por desarrolladores de terceros y están disponibles únicamente con fines informativos y de acceso técnico. cTrader Store no es un bróker, por lo que no proporciona asesoramiento de inversión, recomendaciones personales ni ninguna garantía de rentabilidad futura.


Precio
Desde 04/09/2025
1
Ventas