
Deskripsi
QX Candle Pressure Index adalah overlay tekanan candle untuk cTrader yang membantu trader membaca seberapa kuat setiap candle menutup dalam rentangnya sendiri.
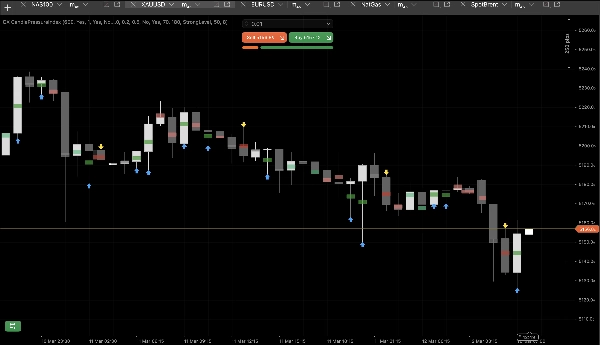
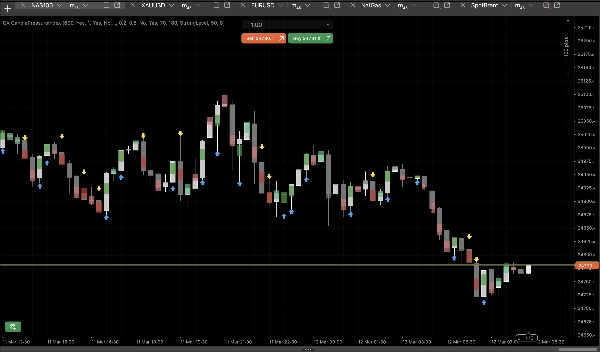
Alih-alih menggunakan jendela osilator terpisah, CPI menampilkan tekanan langsung di grafik utama melalui penanda titik tengah yang ringkas. Ini memudahkan untuk membaca kekuatan penutupan, bias bullish atau bearish, dan momentum jangka pendekdengan lebih sedikit gangguan visual.
Penggunaan Utama
CPI dirancang untuk membantu trader:
- menilai kualitas penutupan candle
- mengonfirmasi tekanan arah
- menilai kekuatan breakout
- membaca pullback dengan lebih jelas
- mendeteksi pergeseran momentum lebih awal
Cara Kerja
Setiap candle diklasifikasikan berdasarkan di mana ia menutup di dalam rentangnya sendiri:
- dekat dengan harga tertinggi = tekanan bullish
- dekat dengan harga terendah = tekanan bearish
- dekat dengan tengah = tekanan netral
Informasi ini ditampilkan menggunakan:
- penanda tekanan titik tengah
- 5 zona tekanan
- panah opsional untuk tekanan kuat
- overlay body opsional
Zona Tekanan
CPI memisahkan candle menjadi 5 kondisi visual:
- Beli Kuat
- Beli Ringan
- Netral
- Jual Ringan
- Jual Kuat
Ini membantu trader mengidentifikasi apakah pergerakan itu kuat, lemah, atau seimbang.
Fitur Utama
Penanda Tekanan Titik Tengah
Penanda visual ringkas yang dipasang di titik tengah candle.
5 Zona Tekanan
Pemisahan jelas antara penutupan yang kuat, ringan, dan netral.
Lewati Bar yang Sedang Terbentuk
Mengabaikan candle yang sedang berlangsung sampai menutup untuk pembacaan yang lebih stabil.
Sembunyikan Penanda Netral
Menjaga grafik lebih bersih dengan hanya menampilkan candle yang berarah.
Mode Panah
Menyoroti candle bullish atau bearish yang kuat secara visual.
Overlay Body
Menambahkan lapisan tambahan yang halus untuk memudahkan pembacaan grafik.
Parameter Utama dan Cara Menggunakannya
Gambar Bar ke Belakang
Mengontrol berapa banyak candle masa lalu yang ditampilkan.
Lewati Bar yang Sedang Terbentuk
Aktifkan untuk pembacaan bar tertutup dan sinyal yang lebih stabil.
Ambang Ringan
Menentukan kapan sebuah candle berhenti menjadi netral.
Ambang Kuat
Menentukan kapan tekanan menjadi kuat.
Sembunyikan Penanda Netral
Gunakan untuk tampilan arah yang lebih bersih.
Mode Panah
Pilih antara tanpa panah, panah pada setiap candle kuat, atau panah hanya pada transisi kuat.
Skala / Lebar / Opasitas Penanda
Sesuaikan tampilan visual agar sesuai dengan gaya grafik Anda.
Terbaik Digunakan Untuk
- konfirmasi kelanjutan tren
- penilaian kualitas breakout
- analisis pullback
- pembacaan momentum jangka pendek
- interpretasi price-action yang lebih bersih
Ringkasan
QX Candle Pressure Index adalah alat visual yang bersih untuk trader yang ingin membaca tekanan candle langsung di grafik, tanpa menambahkan panel indikator lain.
Ringkasan
Ulasan pelanggan
5 | 50 % | |
4 | 50 % | |
3 | 0 % | |
2 | 0 % | |
1 | 0 % |


