
Descripción
🚀 Más de 10,000 traders ya usan nuestros indicadores TOP🏆
Descubre por qué los profesionales nos eligen – las herramientas más poderosas en cTrader (indicadores, algoritmos y cBots) te están esperando.
👉 Obtén todos nuestros sistemas TOP aquí:
_______________________________________________
_______________________________________________
📌 Indicadores de Estructura de Mercado
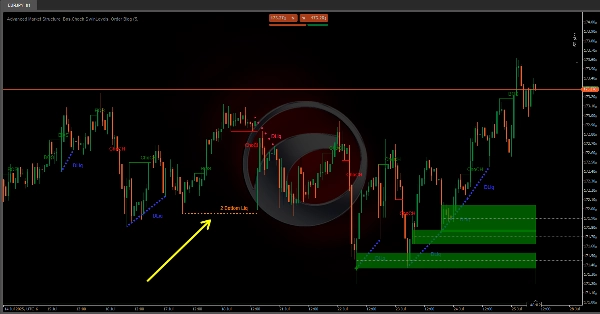
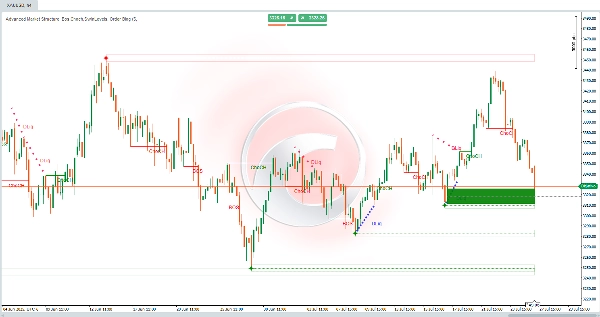
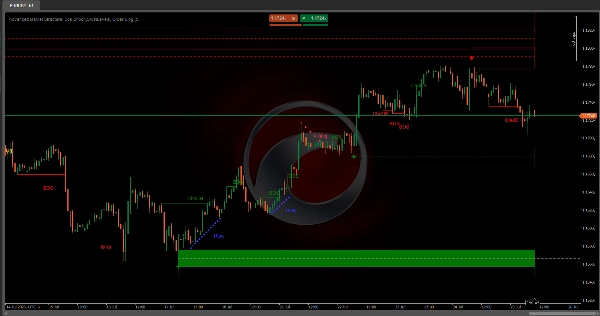
· ✅ AdvancedMarket Structure: Bos, Choch, SwinLevels, Order Blocks, Market Structure& Liquidity Finder
· 🔄 Análisis Dinámico de la Estructura de Mercado de Puntos de Giro
· 🧱 Bloque de Orden
· ⛓️ BOS & CHOCH
· 🧠 ICT Poder de 3
· 🌀 Zonas de Polaridad de Mercado
______________________________________________________________-
Tienda cBots : 🧠 Gold & BTC BreakoutPivotes de Sesión 🧠
_______________________________________________
🔚 Sistemas de Salida Inteligente
· 📍 Algoritmo Inteligente de Seguimiento
_______________________________________________
📐 Indicadores ZigZag
· 🔍 Proyección de Liquidez de Precio ZigZag
· ➖ ZigZag
· 🎯 Rastreador de Extremos Zig-Zag
_______________________________________________
🧱 Indicadores de Soporte y Resistencia
· 🟩 Líneas de Soporte y Resistencia SmartTrend
· 🧱 Todos los Niveles de Soporte y Resistencia
_______________________________________________
📊 Indicadores de Tendencia y Canal
· 🔄 Canal de Tendencia Automático
· 📊 Supertrend
· ⚡Analizador de Tendencia Momentum
· 🧠 Canal de Tendencia Adaptativo
· 💥 Sistema de Ruptura de Canal
· 🌈 Gradiente Dinámico de Tendencia
_______________________________________________
💧 Herramientas de Volumen y Liquidez
· 🔥 Mapa de Calor de Volumen POC
· 📉 Mapa de Liquidación de Apalancamiento
· 🔍 Brecha de Valor Justo Momentum
· 🕒 Sesiones de Brecha de Valor Justo
_______________________________________________
⚡ Indicadores de Momentum y RSI
· 📈 Disparador de Tendencia RSI
· 🚀 Momentum de Rango Dinámico
· 🔎 Rastreador de Sesgo de Vela Multi-Nivel
_______________________________________________
🔮 Herramientas de Predicción y Proyección
· 📐 Predicción Basada en Linreg& ATR
· 📏 Regresión Lineal Fibonacci Multi-marco temporal
· 📈 Proyector de Flujo de Mercado Potenciado por Volumen
Advanced Market Structure: Bos, Choch, SwinLevels, Order Blocks, Market Structure & Liquidity Finder.
¿Qué es?
Una herramienta avanzada de acción del precio que combina múltiples conceptos de análisis técnico en un indicador poderoso. Integra:
- 📊 Estructura de Mercado
- 🔄 Niveles de Swing
- 🧱 Bloques de Orden
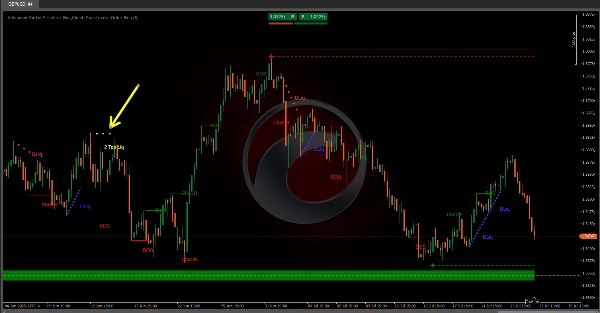
- 💧 Buscador de Liquidez (2 Fondos & 2 Techos)
Objetivo: Identificar puntos clave de entrada/salida, tendencias, soporte/resistencia y zonas institucionales donde el precio reacciona.
🧠 Filosofía Central: Dinero Inteligente
Los mercados están impulsados por jugadores institucionales (bancos, fondos, creadores de mercado) con recursos superiores. Ellos crean patrones para:
- 🕵️♂️ Ocultar operaciones durante acumulación/distribución.
- 🎯 Cazar liquidez (stop losses minoristas).
- 🚀 Impulsar movimientos explosivos en mercados desequilibrados.
🔑 Componentes:
1. Bloques de Orden
- Qué: Zonas donde las instituciones ejecutaron órdenes masivas, creando desequilibrios.
- Tipos:
-
- 🟢 Alcista (Demanda): Compra institucional agresiva.
- 🔴 Bajista (Oferta): Venta institucional agresiva.
- Señal Clave: Precio rebotando/revirtiendo en bloques de orden.
- Detección:
-
- Picos de volumen cerca de máximos (bajista) o mínimos (alcista).
2. Niveles de Swing
- Propósito: Definir la estructura del mercado mediante máximos/mínimos clave.
- Rupturas Críticas:
-
- 🔺 Ruptura de Máximo de Swing: Continuación alcista.
- 🔻 Ruptura de Mínimo de Swing: Continuación bajista.
3. Ruptura de Estructura (BoS)
- Definición: Ruptura decisiva de máximos de swing (alcista) o mínimos (bajista).
- Conexión Fractal:
-
- 🐂 Fractal Alcista: Patrón de 5 velas con mínimo central más bajo.
- 🐻 Fractal Bajista: Patrón de 5 velas con máximo central más alto.
4. Cambio de Carácter (ChoCh)
- Definición: Cambio estructural que señala reversión de tendencia.
- Disparadores:
-
- Ruptura de mínimos de swing en tendencias alcistas (ChoCh bajista).
- Ruptura de máximos de swing en tendencias bajistas (ChoCh alcista).
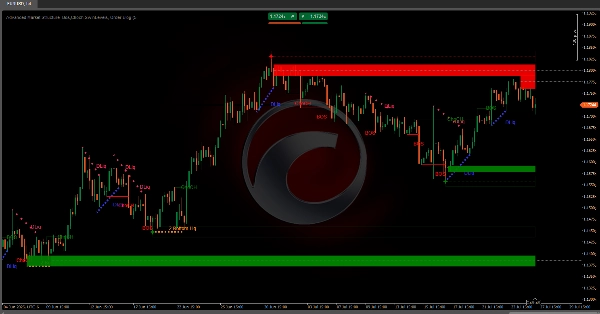
5. Zonas de Liquidez
- Tipos:
-
- ⚖️ Estáticas: Niveles horizontales con máximos/mínimos agrupados (filtrados por ATR).
- 🏃 Dinámicas: Líneas de tendencia que conectan pivotes pronunciados.
- Patrones Clave:
-
- 🕯️ 2 Techos/2 Fondos: Cazas de stops institucionales.
- ⛰️ Triple Techo/Fondo: Zonas de alta congestión.
🎯 Aplicaciones Clave
- ✅ Identificar tendencias/reversiones a través de BoS/ChoCh.
- 📍 Localizar soporte/resistencia usando niveles de swing y zonas de liquidez.
- 🏦 Detectar bloques de orden institucionales.
- 🎯 Predecir objetivos de precio a través de zonas de liquidez.
🔄 Estrategias de Dinero Inteligente
Señales de Fase Acción Institucional
1. Acumulación
ChoCh alcista + bloque de orden de demanda 📈
Dinero Inteligente compra
2. Markup
BoS consecutivos + brechas FVG 🚀
El retail impulsa el momentum
3. Distribución
ChoCh bajista en liquidez de 2 techos 🎯
Dinero Inteligente vende
4. Markdown
BoS bajista + liquidación en zona de descuento 🔻
Cazas de stops en mínimos
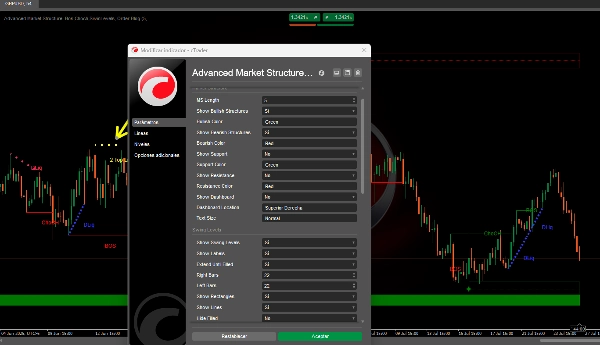
⚙️ Guía de Ajuste de Parámetros
Estructura de Mercado
Longitud MS:-
- ⬆️ Aumentar: Menos fractales pero más confiables.
- ⬇️ Disminuir: Más sensible (riesgo de ruido).
Niveles de Swing
TamañoSwingL/R:-
- ⬆️ Aumentar: Identifica swings significativos.
- ⬇️ Disminuir: Captura reversales menores.
Extender Hasta Completar:-
- ✅ Habilitado: Los niveles persisten hasta que el precio los alcanza.
Bloques de Orden
Método de Mitigación:-
- ✨
Mecha: Señales más rápidas (toca la mecha). - 🎯
Cierre: Señales más fuertes (cierra fuera del bloque).
- ✨
Buscador de Liquidez
Sensibilidad Estática/Dinámica:-
- ⬆️ Aumentar: Menos zonas (mayor calidad).
- ⬇️ Disminuir: Más zonas (mayor sensibilidad).
Resumen
Key components include:
- **Order Blocks:** Zones of significant institutional buying (bullish) or selling (bearish) identified by volume spikes near highs or lows, signaling potential price rebounds or reversals.
- **Swing Levels:** Critical highs and lows defining market structure, with breaks indicating bullish or bearish continuations.
- **Break of Structure (BoS):** Decisive breaks of swing highs or lows, linked to fractal patterns, signaling trend direction.
- **Change of Character (ChoCh):** Structural shifts indicating trend reversals, triggered by breaking swing lows in uptrends or swing highs in downtrends.
- **Liquidity Zones:** Static (horizontal levels with clustered highs/lows) and dynamic (trendlines connecting pivots) zones highlighting institutional stop hunts and congestion areas.
The indicator supports smart money concepts, reflecting institutional market behavior phases: Accumulation, Markup, Distribution, and Markdown. Parameter tuning options allow adjustment of sensitivity and signal strength for Market Structure, Swing Levels, Order Blocks, and Liquidity Finder components. This tool aims to enhance market analysis by revealing institutional activity and improving trade decision-making.
Valoraciones de clientes
5 | 33 % | |
4 | 67 % | |
3 | 0 % | |
2 | 0 % | |
1 | 0 % |


