Descripción
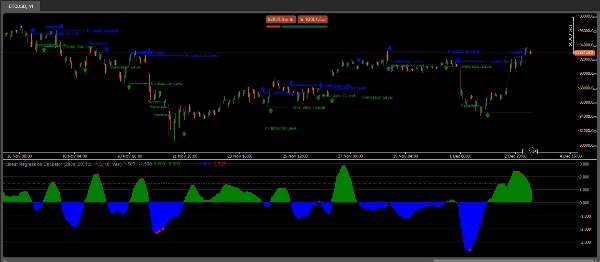
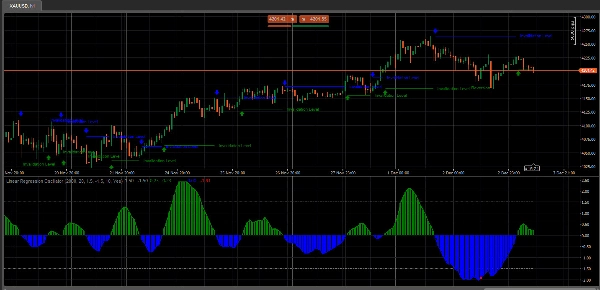
El Oscilador de Regresión Lineal (LRO) es un indicador técnico basado en el análisis de regresión lineal, comúnmente utilizado en los mercados financieros para evaluar el impulso y la dirección de las tendencias de precios. Mide la distancia entre el precio actual y el valor predicho por una línea de regresión lineal, que es esencialmente la línea de mejor ajuste durante un período especificado. Aquí hay un desglose de cómo funciona y sus componentes:
Componentes clave del Oscilador de Regresión Lineal
- Línea de Regresión Lineal (Línea de Mejor Ajuste): Esta línea representa el movimiento esperado del precio durante un cierto período y se calcula utilizando técnicas de regresión lineal. La pendiente de la línea indica la dirección de la tendencia: una pendiente positiva sugiere una tendencia alcista, mientras que una pendiente negativa apunta a una tendencia bajista.
- Valores del Oscilador: El valor del oscilador se calcula midiendo la desviación entre el precio actual y la línea de regresión lineal. Esta desviación se representa como un valor oscilador, que típicamente oscila alrededor de una línea cero.
- Línea Cero: La línea cero en un gráfico del LRO actúa como una línea base. Cuando el valor del oscilador cruza por encima de la línea cero, sugiere un impulso alcista, y un cruce por debajo sugiere un impulso bajista.
- Configuraciones y Períodos: La configuración del período define el número de barras o puntos de datos considerados para calcular la línea de regresión lineal. Los traders ajustan esta configuración para adaptarse a estrategias de trading a corto o largo plazo, dependiendo de su marco temporal de análisis preferido.
Cómo usan los traders el Oscilador de Regresión Lineal
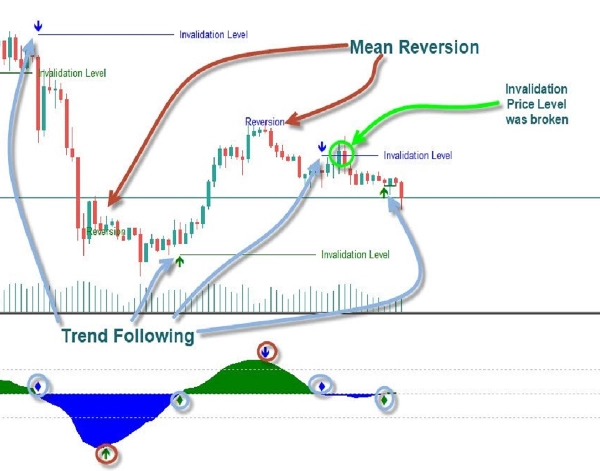
- Identificación de Tendencias: El LRO ayuda a los traders a ver si la tendencia actual del precio tiene impulso mostrando la distancia relativa entre el precio y su línea esperada (de regresión).
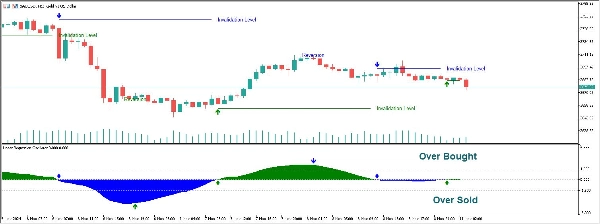
- Niveles de Sobrecompra/Sobreventa: Valores extremos en el oscilador pueden indicar condiciones de sobrecompra o sobreventa, sugiriendo una posible reversión o la necesidad de ajustar posiciones.
- Señales de Divergencia: Cuando los movimientos del precio y el indicador LRO divergen, puede señalar un debilitamiento del impulso o una posible reversión.
Consejos para la interpretación
- Cruce de la Línea Cero: Un cruce por encima de cero puede indicar una tendencia alcista emergente, mientras que un cruce por debajo de cero sugiere una tendencia bajista.
- Ajuste de Períodos: Períodos más cortos hacen que el LRO sea más sensible, capturando movimientos rápidos del precio pero aumentando el ruido. Períodos más largos suavizan las fluctuaciones, adecuados para identificar tendencias a más largo plazo.
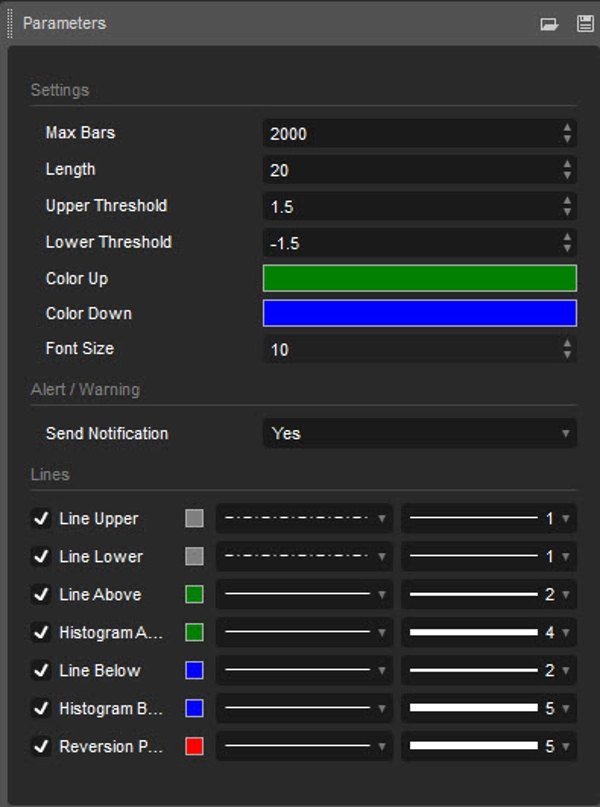
Notas de uso:
- Longitud: Determina el período sobre el cual se calcula la regresión lineal
- Umbral Superior/Inferior: Define los límites superior e inferior para identificar condiciones de sobrecompra y sobreventa. Valores fuera de estos umbrales sugieren posibles reversiones.
El Oscilador de Regresión Lineal es valorado por combinar análisis estadístico con principios de seguimiento de tendencias, lo que lo convierte en una herramienta versátil tanto para traders de impulso como de tendencia. Es particularmente útil en mercados con tendencia, donde ayuda a identificar continuaciones o reversiones de tendencia basadas en desviaciones de la línea de tendencia de regresión.
Resumen
Valoraciones de clientes
5 | 0 % | |
4 | 100 % | |
3 | 0 % | |
2 | 0 % | |
1 | 0 % |


![Logotipo de "[Stellar Strategies] Market Session Ultimate"](https://cdn.ctrader.com/image/webp/61ffd537-0125-4246-9e72-42eca1791d64_28232)


![Logotipo de "[Hamster-Coder] Moving Average MTF"](https://cdn.ctrader.com/image/webp/b11b98b1-194d-4b8e-b00e-d611826ad159_31226)