
Descripción
Uno de los mayores errores que cometen los traders nuevos es que intentan crear tanta información como sea posible en un gráfico añadiendo demasiados indicadores y el resultado es un gráfico lleno de ruido con líneas y datos que ofrecen todo tipo de disparates que dan al trader una historia contradictoria.
Ventajas:
- Precisión asombrosa para detectar reversiones.
- Visualmente agradable y fácil de ver las condiciones del mercado.
- Puede usarse como un indicador de trading de tendencia o de trading contra tendencia.
- Fuertes resultados en back-testing (~95% de precisión en señales Extremas).
Desventajas:
- Incluso con condiciones de Sobrecompra "Extrema" y Sobreventa "Extrema", el indicador a veces puede hacer que operes en la dirección contraria de una tendencia muy fuerte, causando grandes pérdidas antes de que el precio finalmente se revierta.
- Las señales de Sobrecompra "Extrema" y Sobreventa "Extrema" pueden ser pocas y espaciadas cuando se opera en el marco temporal de 15 minutos o superior. Para contrarrestar esto, se recomienda operar al menos 8 pares principales para recibir señales Extremas con frecuencia.
Cómo usar Chaos Reversals
Se puede crear un sistema simple y ganador usando Chaos marcando líneas de Soporte y Resistencia Semanales y Diarias y operando contra tendencia los rebotes que se aproximan de esas líneas de soporte y resistencia usando las señales de Sobrecompra Extrema y Sobreventa Extrema del Chaos de 15 minutos.
Las señales se generan de la siguiente manera:
- El W%R rápido se mueve primero, seguido por el W%R lento.
- Cuando el W%R rápido único está Sobrevendido o Sobrecomprado, puedes hacer scalping con estas reversiones.
- Cuando tanto el W%R rápido como el lento están Sobrevendidos o Sobrecomprados, esto indica que el mercado va a revertirse significativamente.
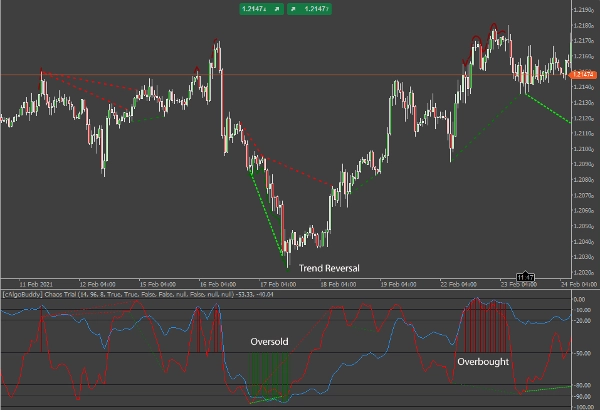
El indicador dibujará una línea roja o verde sobre los mínimos o máximos en el gráfico de precios, así como líneas rojas o verdes en el área del indicador para marcar las condiciones extremas de sobreventa o sobrecompra. Puedes desactivar esto en las opciones del indicador.
Detección de Divergencias
Dado que W%R es un oscilador, nos da la oportunidad de detectar y operar divergencias. Hay dos tipos principales de Divergencia: Regular y Oculta.
- La divergencia regular es una indicación de un cambio en la dirección del precio.
- La divergencia oculta es una indicación de una continuación en la dirección del precio.
Dentro de cada tipo principal, hay una clasificación secundaria: Bajista (Negativa) y Alcista (Positiva).
- Una divergencia bajista ocurre cuando el indicador baja mientras el precio sube o se mantiene estable.
- Una divergencia alcista ocurre cuando el indicador sube mientras el precio baja o se mantiene estable.
Divergencia Regular
La Divergencia Regular en términos simples es cuando:
- El precio hace máximos más altos mientras la línea rápida del W%R hace máximos más bajos: posible venta.
- El precio hace mínimos más bajos mientras la línea rápida del W%R hace mínimos más altos: posible compra.
En cualquier caso, un trader busca una posible reversión en la acción del precio.
La divergencia regular se usa mejor comparando el Swing High o Swing Low actual con el Swing High o Swing Low anterior. Con la divergencia regular, la tendencia se está debilitando y el sentimiento del mercado ha cambiado en la dirección opuesta. Los traders pueden prepararse para operar una reversión o retroceso favorable.
En Chaos Reversals, la divergencia regular se muestra de la siguiente manera:
- Divergencia Regular Alcista – Línea verde brillante con guiones estrechos.
- Divergencia Regular Bajista – Línea roja con guiones estrechos.
NOTA: Las líneas de divergencia aparecen en la apertura de la barra siguiente a una divergencia confirmada.
Divergencia Oculta
La Divergencia Oculta en términos simples es cuando:
- La línea rápida del W%R hace mínimos más bajos mientras el precio hace mínimos más altos: posible compra.
- La línea rápida del W%R hace máximos más altos mientras el precio hace máximos más bajos: posible venta.
En cualquier caso, un trader busca una posible continuación en la acción del precio.
La divergencia oculta se usa mejor para evaluar precios relacionados con la tendencia predominante. Después de un retroceso, el precio a menudo continuará en la dirección de la tendencia hacia el nivel del último Swing High o Swing Low. Con la divergencia oculta, la tendencia puede estar debilitándose pero aún no ha terminado. Como se muestra a continuación, el mercado retrocedió probablemente debido a toma de ganancias y parece que reanudará la tendencia bajista.
En Chaos Reversals, la divergencia oculta se muestra de la siguiente manera:
- Divergencia Oculta Bajista – Línea verde con guiones anchos.
- Divergencia Oculta Alcista – Línea rojo oscuro con guiones anchos.
Operar con Divergencia
Esta es una nota rápida de precaución al operar con Divergencia. Ten en cuenta que el mercado puede no moverse en la dirección de una señal de Divergencia. Es importante entender que la Divergencia es una indicación de un potencial cambio o continuación en la dirección del mercado. Es importante monitorear el movimiento del precio para confirmar la dirección del mercado. También, toma nota de la dirección general del Indicador Chaos, comparando las líneas del indicador con los niveles (0 para sobrecompra extrema, -100 para sobreventa extrema)
Alertas y Notificaciones
Las señales que se enviarán son el inicio y fin de Sobrecompra/Sobreventa Extrema, el pico lento del W%R en posiciones extremas, así como todas las divergencias.
Alertas de Telegram
Dado que tienes un bot y un canal configurados en Telegram, el indicador Chaos Reversals te enviará mensajes para señales confirmadas en el par de divisas.
IMPORTANTE:
Por favor, asegúrate de que tu zona horaria esté correctamente ajustada a tu hora local (esquina inferior derecha de la aplicación).
Alertas de Escritorio
Si seleccionas Sí, el indicador Chaos Reversals enviará una notificación en forma de cuadro de mensaje en tu escritorio personal para señales confirmadas.
Alertas por Email
Para que esta funcionalidad funcione, primero debes configurar tu cTrader para poder enviar correos electrónicos (Configuración-> Email).
Resumen
Valoraciones de clientes
5 | 100 % | |
4 | 0 % | |
3 | 0 % | |
2 | 0 % | |
1 | 0 % |


![Logotipo de "[Hamster-Coder] Pivot Points MTF"](https://cdn.ctrader.com/image/webp/4c143e5a-309c-40e3-a578-f04d1e133ffa_31159)


