
Descripción
Introducción a ADX
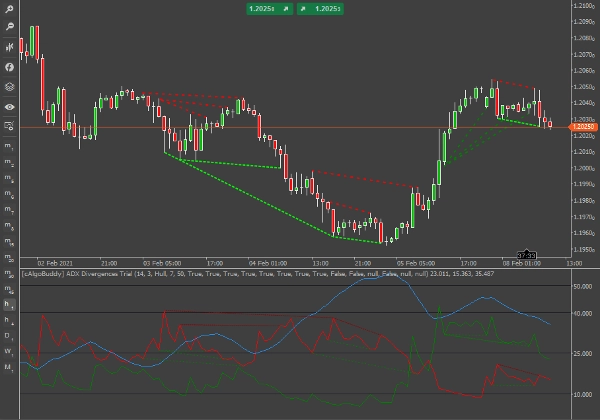
ADX (línea azul) se representa como una sola línea con valores que van desde un mínimo de cero hasta un máximo de 100. ADX es no direccional; registra la fuerza de la tendencia tanto si el precio está en tendencia alcista como bajista. El indicador generalmente se representa en la misma ventana que las dos líneas del indicador de movimiento direccional (Di+ y Di-), de las cuales se deriva el ADX.
Este indicador detecta divergencias en las líneas Di+ y Di-. A diferencia de otros indicadores que detectan divergencias, con este podemos extraer información más valiosa de las otras 2 contrapartes de una señal de divergencia. Por ejemplo, si ocurre una divergencia en Di+, podemos evaluar la señal teniendo en cuenta los niveles de Di- y ADX.
Las líneas Di+ y Di- están parcialmente suavizadas con una media móvil Hull de 3 períodos. Para una locura de divergencias al 100%, puedes configurar el período de la MA a 1 y el tipo de media móvil a Simple. Sin embargo, dado que dibujamos divergencias en 2 líneas en la misma ventana del indicador, a veces puedes sentirte abrumado por las señales. Por otro lado, puedes seleccionar desde la configuración del indicador exactamente qué tipos de divergencias quieres ver y para qué línea (Di+ o Di-).
Una señal de divergencia se considera confirmada en la apertura de la barra siguiente a la divergencia. Sin embargo, debido a la naturaleza “inflexible” de las líneas de tendencia ADX (en comparación con, digamos, el RSI), cada vez que aparece una línea de divergencia, probablemente permanecerá allí hasta la barra de confirmación, a menos que ocurra una volatilidad extrema.
Antes de operar cualquier señal de divergencia, identifica lo siguiente:
- Dirección y nivel del ADX
- Distancia entre Di+ y Di-
- Dirección y nivel de Di+
- Dirección y nivel de Di-
También, ten en cuenta
- Evita tomar cualquier operación de divergencia cuando el ADX esté bajo (menor que 15 y en tendencia descendente), ya que las señales deben tomarse basándose en tendencias ya desarrolladas o en desarrollo.
- También, ten en cuenta que el cruce de Di+ y Di- se considera una señal alcista/bajista en sí misma, así que modifica tus posiciones en consecuencia.
- En caso de que tanto Di+ como Di- diverjan en la misma vela, elige la línea correspondiente mejor según la tendencia (tendencia alcista/señal alcista Di+, tendencia bajista/señal bajista Di-).
- No tienes que operar cada señal.
Divergencias en DiPlus
DiPlus (Verde) es la línea que representa la fuerza de la tendencia alcista. Podemos detectar divergencias entre la fuerza de la tendencia alcista de manera similar a la mayoría de osciladores.
Divergencia Alcista Regular
Definición: El precio hizo un mínimo más bajo pero el indicador hizo un mínimo más alto. El resultado ideal es: Después de un pequeño repunte alcista, deberíamos ver desarrollarse una tendencia bajista. Representado con una línea verde claro punteada en las ventanas de precio e indicador.
Una tendencia bajista dominante que está comenzando a desarrollarse o ya está desarrollada. Entramos en corto después de que haya ocurrido la pequeña corrección. En algunos casos, la divergencia en Di+ puede ocurrir en una vela bajista, una buena confirmación de la tendencia bajista dominante.
Ocasionalmente, el repunte alcista desarrollará una tendencia alcista. Esto puede ocurrir cuando hay poca o ninguna tendencia (Di+ y Di- están cerca uno del otro, ADX< 20) o después del agotamiento de la tendencia bajista en niveles de resistencia.
Divergencia Alcista Oculta
Definición: El precio hizo un mínimo más alto y el indicador hizo un mínimo más bajo. Deberíamos esperar un desarrollo o continuación de la tendencia alcista. Representado con una línea verde oscuro parcialmente punteada en las ventanas de precio e indicador.
Una tendencia alcista dominante que está comenzando a desarrollarse o ya está desarrollada. Entramos en largo después de que haya ocurrido la pequeña corrección. El stop-loss debe colocarse alrededor del mínimo de la vela de divergencia.
Una de las mejores señales de este indicador, principalmente porque esperamos una continuación inmediata de la tendencia y podemos mantener nuestros stop-loss al mínimo.
Divergencia Bajista Regular
Definición: El precio hizo un máximo más alto pero el indicador hizo un máximo más bajo. Después de una pequeña caída bajista, deberíamos ver desarrollarse una tendencia alcista. Representado con una línea roja oscura punteada en las ventanas de precio e indicador.
Una tendencia alcista dominante sigue en ascenso (ADX aún subiendo en el momento de la divergencia).
Las circunstancias para que este escenario ocurra son muy raras ya que Di+ representa la fuerza alcista. Usualmente, estas circunstancias ocurren después de que la tendencia alcista se ha agotado, lo que significa que es el “pico” final antes de que comience a desarrollarse la tendencia bajista. Por lo tanto, la mayoría de las veces se recomienda entrar en corto con esta señal.
Divergencia Bajista Oculta
Definición: El precio hizo un máximo más bajo y el indicador hizo un máximo más alto. Deberíamos esperar una continuación de la tendencia bajista. Representado con una línea roja parcialmente punteada en las ventanas de precio e indicador.
Una tendencia bajista dominante con picos alcistas (ADX aún subiendo en el momento de la divergencia).
Pedir una continuación de la tendencia bajista desde la línea de tendencia alcista es contraintuitivo, por eso esta señal debe tomarse con mucha precaución. A menudo, el mercado entrará en una fase de consolidación después de esta divergencia.
En un mercado sin tendencia, evita tomar una operación. En una tendencia bajista agotada, si eliges entrar en corto, haz scalping.
Divergencias en DiMinus
DiMinus (Rojo) es la línea que representa la fuerza de la tendencia bajista. La forma en que detectamos divergencias en el precio y DiMinus es de alguna manera inversa a la forma en que detectamos divergencias en DiPlus.
Divergencia Alcista Regular
Definición: El precio hizo un mínimo más bajo pero el indicador hizo un máximo más bajo (en lugar de un mínimo más alto). Después de un pequeño repunte alcista, deberíamos ver desarrollarse una tendencia bajista. Representado con una línea verde claro punteada en la ventana de precio y una línea roja oscura punteada en la ventana del indicador.
Una tendencia bajista dominante que está comenzando a desarrollarse o ya está desarrollada. Entramos en corto después de que haya ocurrido la pequeña corrección. En algunos casos, la divergencia en Di- puede ocurrir en una vela bajista, una buena confirmación de la tendencia bajista dominante.
Al igual que la señal proveniente de la contraparte Di+, a veces el repunte bajista desarrollará una tendencia bajista. Esto puede ocurrir cuando hay poca o ninguna tendencia (Di+ y Di- están cerca uno del otro, ADX< 20) o después del agotamiento de la tendencia alcista en niveles de resistencia.
Divergencia Alcista Oculta
Definición: El precio hizo un mínimo más alto y el indicador hizo un máximo más alto (en lugar de un mínimo más bajo). Deberíamos esperar una continuación de la tendencia alcista. Representado con una línea verde parcialmente punteada en la ventana de precio y una línea roja oscura parcialmente punteada en la ventana del indicador.
Es contraintuitivo pedir una continuación de la tendencia alcista desde la línea de tendencia Di-. Necesitamos tener picos bajistas en una tendencia alcista.
Divergencia Bajista Regular
Definición: El precio hizo un máximo más alto pero el indicador hizo un mínimo más alto (en lugar de un máximo más bajo). Después de una caída bajista en el precio, deberíamos ver la continuidad de una tendencia alcista. Representado con una línea roja oscura punteada en la ventana de precio y una línea verde claro punteada en la ventana del indicador.
Se recomienda, en una tendencia alcista fuerte y en desarrollo, entrar en largo. Pero, en un mercado alcista agotado y gastado, entrar en corto.
Divergencia Bajista Oculta
El precio hizo un máximo más bajo y el indicador hizo un mínimo más bajo (en lugar de un máximo más alto). Deberíamos esperar una continuación de la tendencia bajista. Representado con una línea roja parcialmente punteada en la ventana de precio y una línea verde parcialmente punteada en la ventana del indicador.
Una de las mejores señales de este indicador, principalmente porque esperamos una continuación inmediata de la tendencia bajista y podemos mantener nuestros stop-loss al mínimo. El stop-loss debe colocarse en el mínimo de la vela de divergencia.
Alertas instantáneas de mensajes de Telegram
Dado que tienes un bot y un canal configurados en Telegram, el indicador ADX Divergences te enviará mensajes para señales confirmadas en el par de divisas en el que lo ejecutes. Ten en cuenta que solo recibirás señales para aquellos que hayas seleccionado "Sí" para mostrar. Puedes configurar este robot de trading para que también envíe alertas instantáneas de Telegram directamente a tu PC, tableta o teléfono móvil.
IMPORTANTE: Por favor, asegúrate de que tu zona horaria esté correctamente ajustada a tu hora local (esquina inferior derecha de la aplicación).
Alertas de escritorio
Si seleccionas Sí, el indicador ADX Divergences mostrará una notificación en un cuadro de mensaje en tu escritorio personal para señales confirmadas.
Alertas por correo electrónico
Para que esta funcionalidad funcione, primero debes configurar tu cTrader para poder enviar correos electrónicos (Configuración-> Correo electrónico). Si seleccionas Sí, el indicador ADX Divergences enviará un correo electrónico con señales confirmadas a la dirección que hayas ingresado.
Resumen
This indicator detects divergences on both Di+ and Di- lines, allowing traders to analyze signals with additional context from the other directional lines and ADX levels. The Di+ and Di- lines are smoothed using a Hull moving average, adjustable via settings to control signal sensitivity and display preferences.
Divergence signals are confirmed at the opening of the bar following the divergence, with guidance provided on interpreting various divergence types—regular and hidden bullish and bearish divergences—on both Di+ and Di- lines. Users are advised to consider ADX levels, the distance between Di+ and Di-, and the direction and level of each line before trading signals.
The indicator supports instant alerts via Telegram messages, desktop notifications, and email, configurable within the platform. Proper time zone settings are required for accurate alert timing. This tool is applicable across multiple markets including Forex, commodities, indices, stocks, and cryptocurrencies such as BTCUSD and XAUUSD.
Valoraciones de clientes
5 | 100 % | |
4 | 0 % | |
3 | 0 % | |
2 | 0 % | |
1 | 0 % |


