
Weekly Daily Levels
Indicador
2 compras
Versión 1.0, Aug 2025
Windows, Mac
5.0
Valoraciones: 2
Descripción
¿Confía en los precios OHLC diarios y semanales y en los puntos medios en su estrategia de trading? ¿Cansado de marcarlos manualmente cada vez que realiza una operación?
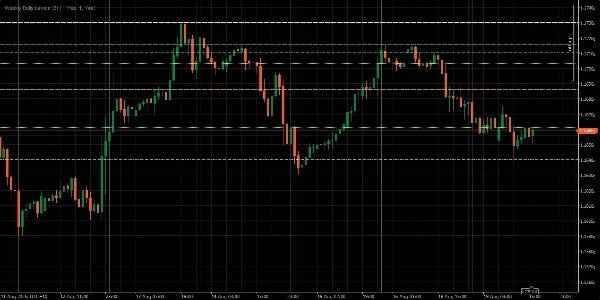
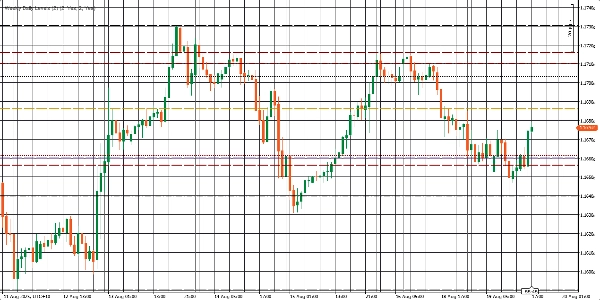
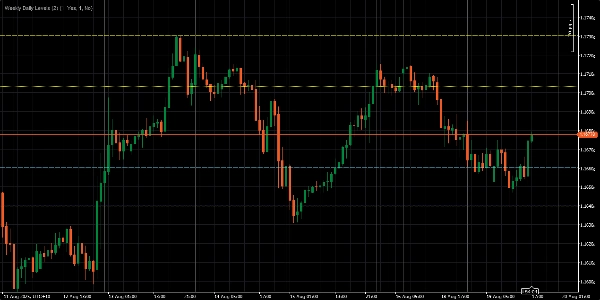
El Indicador de Niveles Semanales y Diarios hace el trabajo pesado por usted. Traza automáticamente los precios de apertura, máximo, mínimo, cierre (OHLC) y puntos medios del día anterior y de la semana anterior directamente en su gráfico. Esto significa que puede concentrarse en ejecutar su estrategia mientras el indicador se encarga de los detalles, haciendo su trading más simple, rápido y mucho más eficiente.
Características clave:
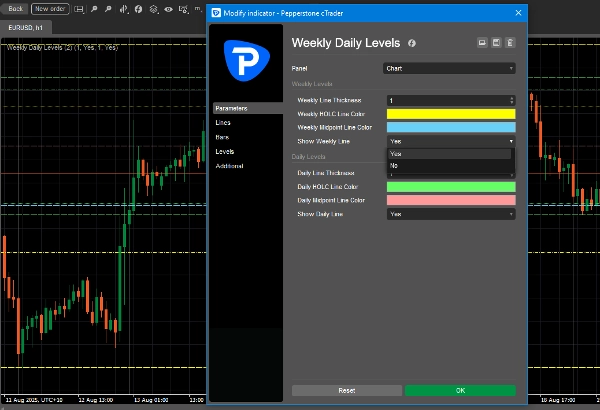
- Muestra instantáneamente los precios OHLC y puntos medios diarios y semanales.
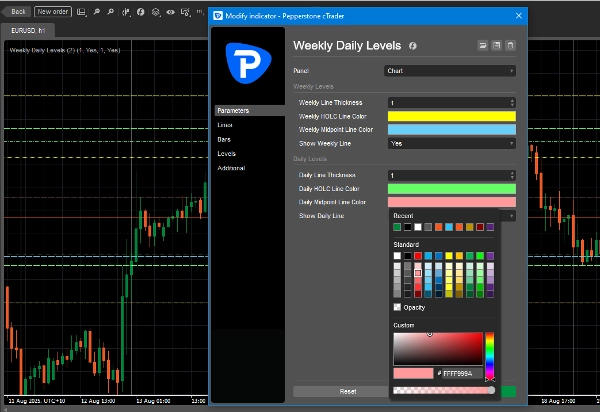
- Personalice los colores de las líneas para que coincidan con el estilo de su gráfico.
- Active o desactive los niveles diarios o semanales con un solo clic.
- Ajuste el grosor de las líneas para una mejor visibilidad.
Resumen
Resumen de IA
The Weekly Daily Levels indicator automatically plots the previous day’s and previous week’s open, high, low, close (OHLC) prices along with their mid-points directly on trading charts. It provides instant visual reference to these key price levels, helping traders incorporate daily and weekly price data into their strategies without manual marking. Users can customize line colors and thickness to fit their chart style and toggle daily or weekly levels on or off with a single click. This indicator streamlines the process of tracking important historical price levels for improved trading efficiency.
Perfil del indicador
Valoraciones de clientes
5.0
Valoraciones: 2
5 | 100 % | |
4 | 0 % | |
3 | 0 % | |
2 | 0 % | |
1 | 0 % |
Valoraciones de clientes
August 28, 2025
Not bad if the rules are already clear. Two timeframes give more context.
August 21, 2025
the good surprise is the setup needs less second guessing, and It works better with a written plan.
Conversación
Preguntas frecuentes
Los productos disponibles a través de cTrader Store, incluidos bots, indicadores y plugins para operar, son proporcionados por desarrolladores de terceros y están disponibles únicamente con fines informativos y de acceso técnico. cTrader Store no es un bróker, por lo que no proporciona asesoramiento de inversión, recomendaciones personales ni ninguna garantía de rentabilidad futura.


Precio
Desde 19/04/2025
2
Ventas