
VegaXLR - RSI and StochRSI Alerts
Indicador
15 compras
Versión 1.0, Apr 2025
Windows, Mac
5.0
Valoraciones: 3
Descripción
VegaXLR - Alertas RSI y StochRSI es un indicador de cTrader que proporciona alertas para eventos de RSI y StochRSI, manteniendo a los traders informados sobre los cambios del mercado. Notifica a los usuarios sobre niveles de sobrecompra/sobreventa, cruces de la línea central y cruces de las líneas K/D, todo con configuraciones personalizables.
Características clave:
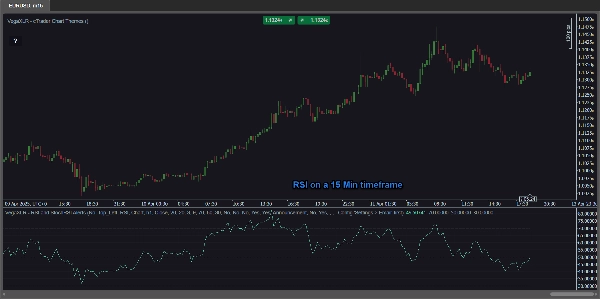
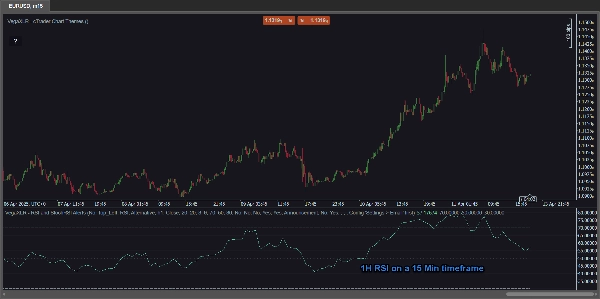
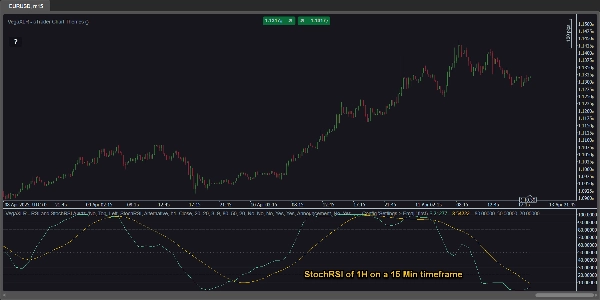
- Análisis Multitemporal: Visualice de manera única los valores de RSI y StochRSI de cualquier marco temporal directamente en su gráfico actual. Por ejemplo, analice el RSI de 1 hora mientras ve un gráfico de 15 minutos, ¡sin cambiar el marco temporal de su gráfico!
- Alertas RSI y StochRSI: Reciba notificaciones para:
-
- Condiciones de sobrecompra y sobreventa
- Cruces de la línea central (50%)
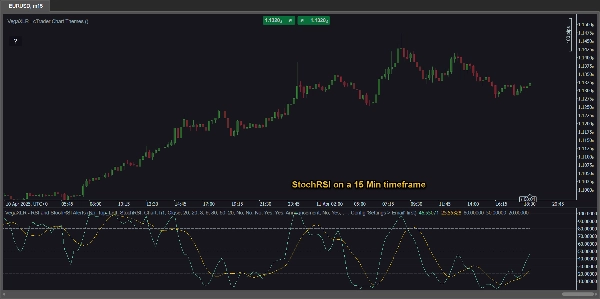
- Cruces de las líneas K y D (StochRSI)
- Configuraciones Personalizables: Ajuste la fuente del RSI, los períodos, los valores K/D y los umbrales de alerta para un control preciso.
- Alertas Versátiles: Elija entre:
-
- Ventanas emergentes de cTrader
- Alertas sonoras
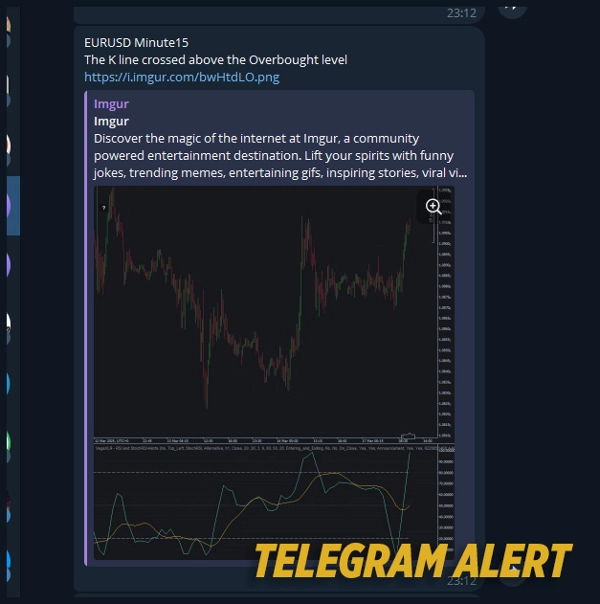
- Alertas de Telegram (con capturas de pantalla opcionales del gráfico)
- Notificaciones por correo electrónico
- Líneas RSI y StochRSI Integradas: ¡No necesita indicadores adicionales, están integrados directamente!
Guía de acceso instantáneo: Un botón conveniente dentro del gráfico abre el manual del usuario.
Resumen
Resumen de IA
VegaXLR - RSI and StochRSI Alerts is a cTrader indicator designed to monitor and notify traders of key RSI and StochRSI events. It provides alerts for overbought and oversold conditions, centerline (50%) crossovers, and K/D line crossovers within the StochRSI. The indicator supports multi-timeframe analysis, allowing users to view RSI and StochRSI values from any timeframe directly on their current chart without switching timeframes. Customizable settings enable adjustment of RSI source, periods, K/D values, and alert thresholds for tailored monitoring. Alert delivery options include cTrader popups, sound alerts, Telegram notifications (with optional chart screenshots), and email messages. The indicator integrates RSI and StochRSI lines internally, eliminating the need for additional indicators. An in-chart button provides instant access to the user manual for guidance. This tool assists traders in identifying precise market shifts and potential trade entry points based on momentum indicators.
Perfil del indicador
Valoraciones de clientes
5.0
Valoraciones: 3
5 | 100 % | |
4 | 0 % | |
3 | 0 % | |
2 | 0 % | |
1 | 0 % |
Valoraciones de clientes
April 27, 2025
Steady choice for testing for traders who use momentum confirmation. It gives value around oscillator setups, but strong trends can keep signals stretched. A clean test needs 25 oscillator signals, 2 timeframe confirmation and a clear 1R exit plan. The tool is useful when overbought or oversold is treated as context, not a command.
April 26, 2025
April 26, 2025
Good enough to inspect for oscillator setups. it gives a familiar read on overextension and momentum, especially when used for checking stretched conditions before entries. RSI style levels around 30 and 70 help, but I would add a 2 swing divergence check. The tool is useful when overbought or oversold is treated as context, not a command.
Conversación
Preguntas frecuentes
RSI
Los productos disponibles a través de cTrader Store, incluidos bots, indicadores y plugins para operar, son proporcionados por desarrolladores de terceros y están disponibles únicamente con fines informativos y de acceso técnico. cTrader Store no es un bróker, por lo que no proporciona asesoramiento de inversión, recomendaciones personales ni ninguna garantía de rentabilidad futura.


Precio
215
Ventas
677
Instalaciones gratis