
الوصف
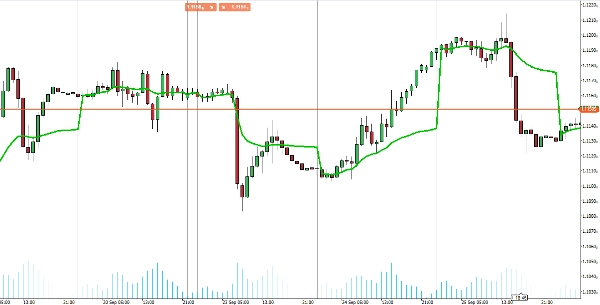
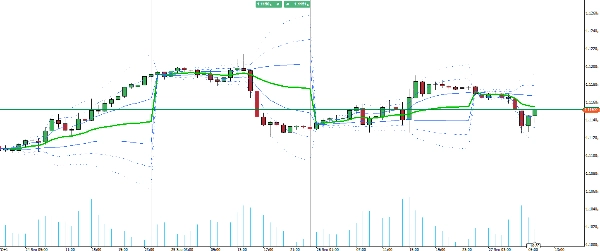
تقديم مؤشر VWAP لـ cTrader، الذي يجلب الوظائف الكاملة لـ متوسط السعر المرجح بالحجم من TradingView إلى منصة التداول الخاصة بك.
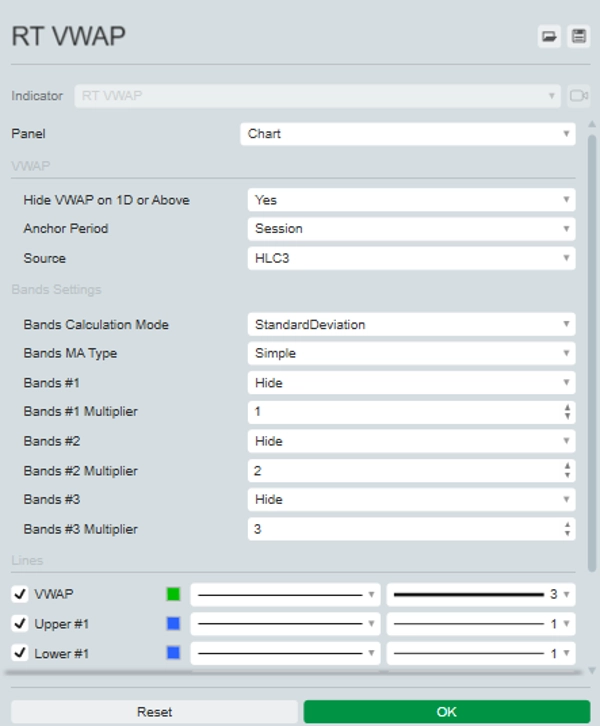
تتيح لك هذه الأداة الشاملة اختيار فترة التثبيت الخاصة بك (الجلسة، الأسبوع، الشهر، الربع، السنة) والاختيار من بين مصادر سعر مختلفة، بما في ذلك الافتتاح، الأعلى، الأدنى، الإغلاق، HL2، HLC3، OHLC4، و HLCC4. بالإضافة إلى ذلك، يمكنها عرض ما يصل إلى ثلاثة نطاقات انحراف معياري علوية وسفلية، مما يوفر رؤية كاملة لتوزيع السعر.
يقوم مؤشر VWAP بالتحديث في الوقت الحقيقي مع بيانات التيك، مما يضمن حصولك على أدق وأحدث الرؤى لاتخاذ قرارات التداول الخاصة بك. ارتقِ باستراتيجيتك التداولية مع مؤشر VWAP المتعدد الاستخدامات والقوي في cTrader.
الملخص
ملف تعريف المؤشر
تقييمات العملاء
0.0
التقييمات: 0
تقييمات العملاء
لا توجد تقييمات لهذا المنتج حتى الآن. هل جرَّبته بالفعل؟ كن أول من يخبر الآخرين!
مناقشة
الأسئلة الشائعة
BTCUSD
Forex
Indices
EURUSD
Commodities
GBPUSD
NZDUSD
Scalping
Crypto
Stocks
XAUUSD
NAS100
USDJPY
VWAP
يتم توفير المنتجات المتاحة من خلال cTrader Store، بما في ذلك روبوتات التداول والمؤشرات والإضافات، من قبل مطوري الطرف الثالث وإتاحتها لأغراض الوصول المعلوماتي والفني فقط. cTrader Store ليس وسيطًا ولا يقدم نصائح استثمارية أو توصيات شخصية أو أي ضمان للأداء المستقبلي.

![شعار "[Hamster-Coder] Moving Average MTF"](https://cdn.ctrader.com/image/webp/b11b98b1-194d-4b8e-b00e-d611826ad159_31226)


السعر
منذ 25/09/2024
20
المبيعات