
MARCs_MARKET_OVERVIEW_PRO
مؤشر
الإصدار 1.0، Aug 2026
Windows, Mac
Trading product for MARCs_MARKET_OVERVIEW_PRO مؤشر Key Levels RSI, image 2
Trading product for MARCs_MARKET_OVERVIEW_PRO مؤشر Key Levels RSI, image 3
Trading product for MARCs_MARKET_OVERVIEW_PRO مؤشر Key Levels RSI, image 4
Trading product for MARCs_MARKET_OVERVIEW_PRO مؤشر Key Levels RSI, image 5
Trading product for MARCs_MARKET_OVERVIEW_PRO مؤشر Key Levels RSI, image 6
Trading product for MARCs_MARKET_OVERVIEW_PRO مؤشر Key Levels RSI, image 7
Trading product for MARCs_MARKET_OVERVIEW_PRO مؤشر Key Levels RSI, image 8
Trading product for MARCs_MARKET_OVERVIEW_PRO مؤشر Key Levels RSI, image 9
Trading product for MARCs_MARKET_OVERVIEW_PRO مؤشر Key Levels RSI, image 10
منذ 24/06/2026
1
التثبيتات المجانية

الوصف

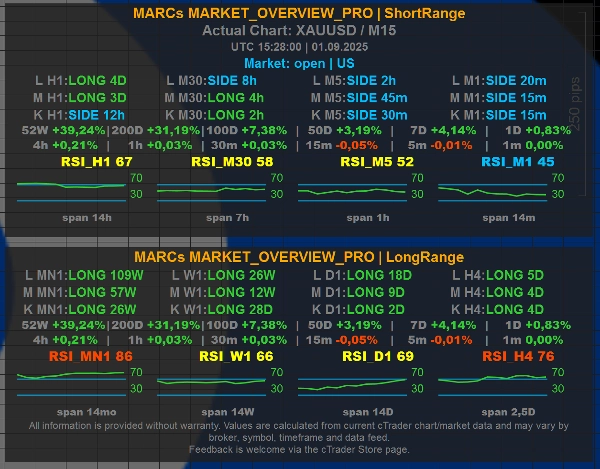
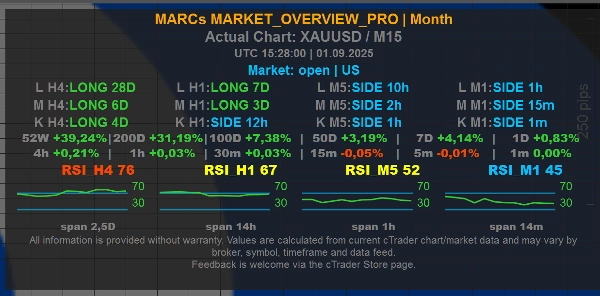
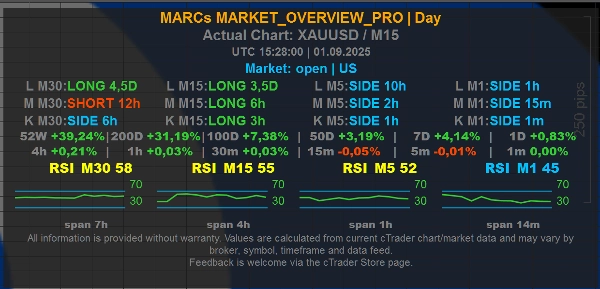
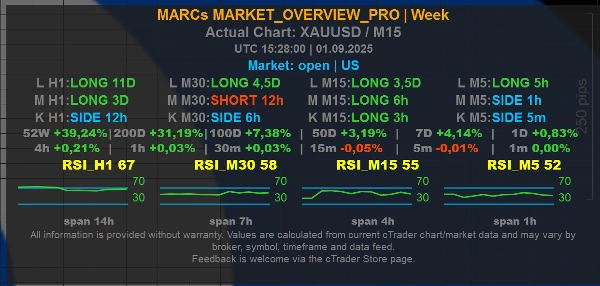
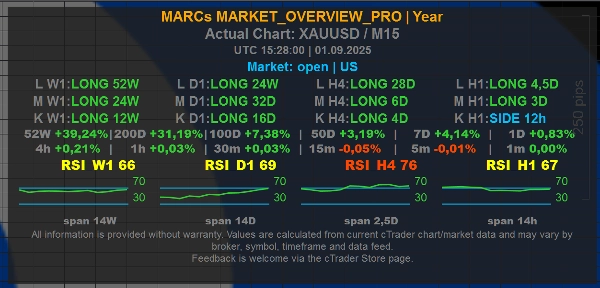
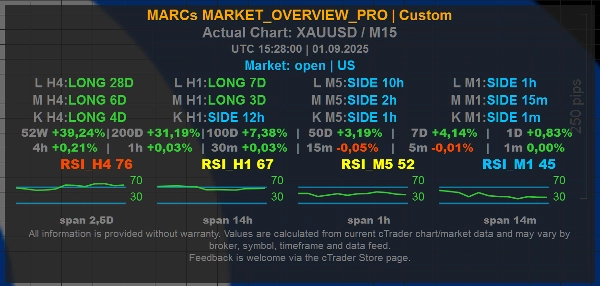
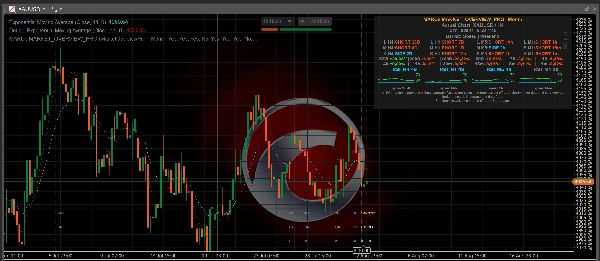
MARCs MARKET_OVERVIEW_Pro is a multi-timeframe market overview indicator for cTrader.


It displays a compact on-chart dashboard with trend context, RSI readings, market/session information and configurable time-horizon presets. The indicator was originally developed around XAUUSD / Gold analysis, but is designed to work as a general market overview tool on any available chart symbol, depending on broker data quality and available market history.


Main features:

- Multi-timeframe trend rows for short, medium and long market context

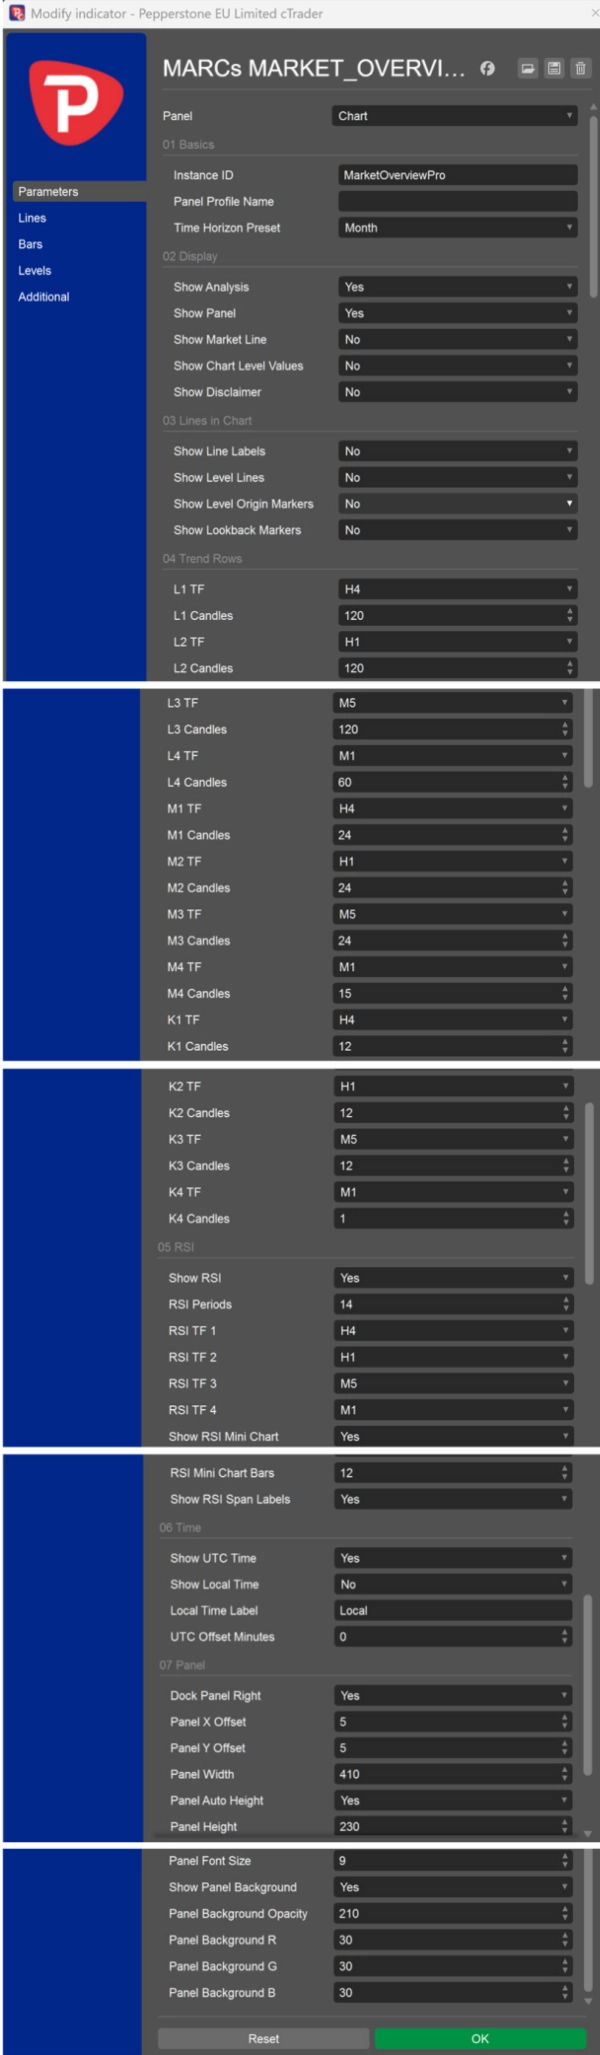
- Configurable Day, Week, Month, Year, ShortRange, LongRange and Custom presets

- RSI values and mini RSI charts across selected timeframes

- Optional UTC and local time display

- Optional market/session line

- Optional chart-level reference lines

- Optional chart-level values shown directly in the panel


Level Lines and Chart Level Values:

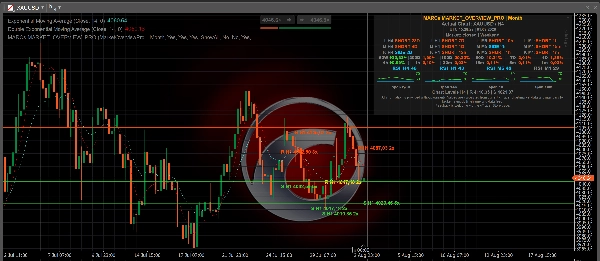
The optional Show Level Lines setting can display calculated chart reference levels from one selected timeframe: M1, M5, M15, M30, H1, H4, D1, W1 or MN1. For these individual timeframe selections, the indicator shows the nearest calculated resistance above the current price and the nearest calculated support below the current price. ShowAll displays the broader H1 level set from the existing H1 level calculation. No keeps level lines hidden.


The optional Show Chart Level Values setting can show the same nearest resistance/support reference values directly in the panel without drawing lines on the chart. The panel line is labelled, for example, "Chart Levels H1 | R ... | S ..." to make clear that the values refer to chart-level references.


How Level Lines are calculated:

The levels are derived from past swing highs and swing lows in the selected timeframe. Nearby swing points are grouped into level clusters, and only areas with enough repeated touches are shown. This makes the lines visual market-context markers based on available chart history.


Important:

MARCs Market Overview Pro is an analysis-only market overview tool. It does not place trades, manage positions, provide investment advice or guarantee trading results.


Level Lines are not buy signals, sell signals, stop-loss recommendations, take-profit recommendations or investment advice. They do not predict that price will reverse, break out or react at a specific level.


All readings depend on the available cTrader chart data, broker symbol feed, timeframe and market history. Values may differ between brokers, symbols and data feeds.


Trading involves risk. Past performance does not guarantee future results.

الملخص

ملخص الذكاء الاصطناعي
MARCs MARKET_OVERVIEW_Pro is a multi-timeframe market overview indicator designed for the cTrader platform. It provides a compact on-chart dashboard that displays trend context across short, medium, and long timeframes, RSI values with mini RSI charts, and market/session information. Users can configure time-horizon presets including Day, Week, Month, Year, ShortRange, LongRange, and Custom settings.
The indicator supports optional display of UTC and local times, market/session lines, and chart-level reference lines. These reference lines represent calculated support and resistance levels derived from clusters of past swing highs and lows on selected timeframes ranging from 1 minute to monthly intervals. Users can choose to show these levels as lines on the chart or as numeric values within the dashboard panel.
Originally developed with a focus on XAUUSD (Gold), MARCs MARKET_OVERVIEW_Pro is adaptable to any chart symbol supported by the broker’s data feed and market history. It serves as an analysis tool providing visual market structure and momentum insights but does not execute trades or offer trading advice. The indicator’s readings depend on the quality and availability of broker data and chart history.
ملف تعريف المؤشر
فئة المؤشر
هيكل السوق (SMC)
نوع المخرجات
التصور
فلتر
متطلبات البيانات
أعمدة السعر فقط
الإشارات المدعومة
قوة الاتجاه
لمس المستوى

تقييمات العملاء

0.0
التقييمات: 0
تقييمات العملاء
لا توجد تقييمات لهذا المنتج حتى الآن. هل جرَّبته بالفعل؟ كن أول من يخبر الآخرين!

مناقشة

الأسئلة الشائعة

Key Levels
RSI
Market Structure
Risk Dashboard
Support & Resistance
يتم توفير المنتجات المتاحة من خلال cTrader Store، بما في ذلك روبوتات التداول والمؤشرات والإضافات، من قبل مطوري الطرف الثالث وإتاحتها لأغراض الوصول المعلوماتي والفني فقط. cTrader Store ليس وسيطًا ولا يقدم نصائح استثمارية أو توصيات شخصية أو أي ضمان للأداء المستقبلي.

المزيد من هذا المؤلف

مؤشر
RSI
Key Levels
+3
MARKs Free XAUUSD market overview dashboard with trend rows, RSI context, sessions and fixed Day/Month presets.
cBot
Conservative
Fixed Risk %
+5
MARCs GOLD H4-Gold-Swing-Bot for XAUUSD with transparent long-term backtests and optional reserve/guard system.
3.01
عامل الربح

قد يعجبك أيضًا

مؤشر
VWAP
Volume
+5
Institutional Session VWAP + 3-Sigma Bands & HUD. Engineered for high-precision Index & Prop Firm Scalping.
مؤشر
Spread Filter
SpreadSync Entry Timer is a compact cTrader indicator that shows live spread and candle-close.
مؤشر
ADX
ATR
+5
Signal Quality Score - 0-100 filter combining RSI, Volume, ATR, Trend Strength & Alignment. Works on ANY chart type.
مؤشر
AI
ATR
+19
QX SessionBox ORB: Session boxes + ORB levels + clean dashboard with optional closed-candle breakout signals.
مؤشر
Forex
Crypto
+3
Consecutive Series Moves — Reveal the True Pulse of Price Action
مؤشر
The Advanced Volume Profile Indicator calculates POC, Median, and Mode, revealing key price levels for smarter trading.
مؤشر
Prop
Forex
+10
Support and Resistance Line Indicator with Higher Timeframe Filter
مؤشر
ATR
Key Levels
+5
CPR indicator that actually predicts the day ahead: width percentile scoring for breakout-day detection
مؤشر
Forex
BTCUSD
+11
Auto-detects Bullish/Bearish Engulfing patterns to spot trend reversals. Real-time alerts, custom colors, all symbols.
مؤشر
SMC
Prop
+14
BoS ChoCH Pro,Strict Mode,False Breakout Filter,Average hit rate: 72-78%
مؤشر
Smoothed CCI alerts! Audio & arrow signals for +/-100 crosses. Custom sounds & arrow filters. Precision trading!
مؤشر
CandleColourFlow MultiFx - optimized to work on Fx Majors, Fx MInors, Fx Crosses
مؤشر
BOS
EMA
+5
Directional volume heatmap: see if a price zone was built on buying or selling, not just how much.
مؤشر
MCDX is a powerful and innovative indicator.
مؤشر
SMC
Forex
+5
ICT liquidity engine for Gold: maps stop clusters, scores zones & projects the next target. Now with 4 ICT killzones.
شعار "ORB v1"
مشهور
5.0
(2)
$19
مؤشر
Breakout
Opening Range Breakout (ORB) - Visual Edition
مؤشر
MACD
Prop
+14
Customize the MACD! Choose colors, get real-time tick updates, and see crossover points for enhanced trading precision.
مؤشر
Signal
USDJPY
See USD demand in one line—Composite OBV fuses six major FX pairs into a clear momentum gauge.

السعر

منذ 24/06/2026
1
التثبيتات المجانية

















