
Higher TimeFrame Candle Tracker
مؤشر
1 عمليات الشراء
الإصدار 1.0، Oct 2025
Windows, Mac
الوصف
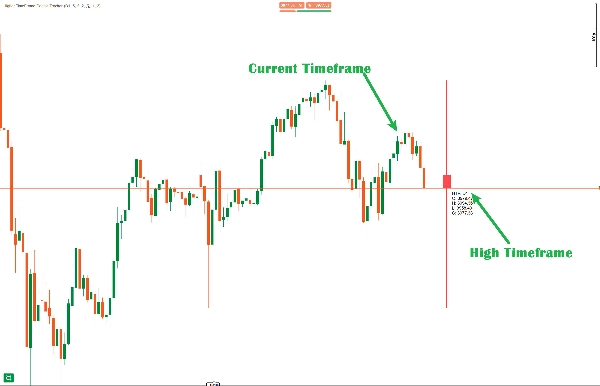
يُستخدم متتبع شموع الإطار الزمني الأعلى للحصول على لمحة عن شكل شمعة الإطار الزمني الأعلى المحدد.
الميزات الرئيسية:
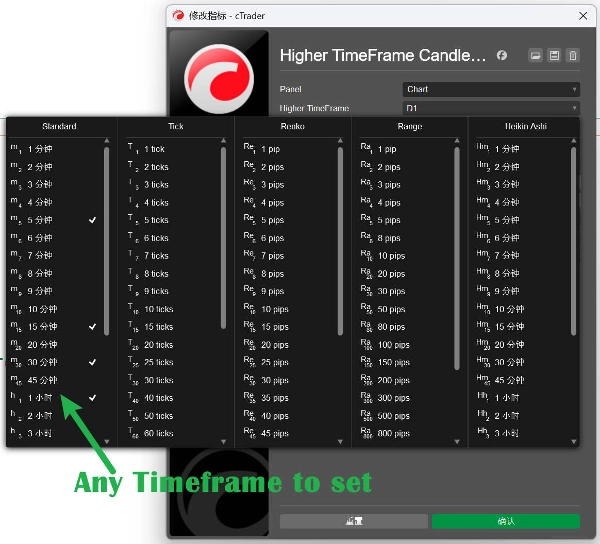
- اختيار الإطار الزمني القابل للتخصيص - اختر أي إطار زمني أعلى (يومي، أسبوعي، شهري، إلخ)
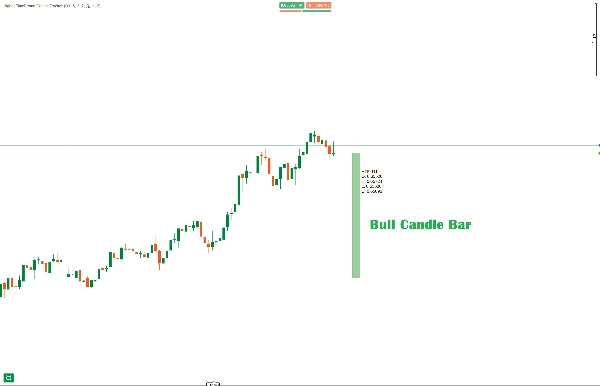
- عرض الشمعة بصريًا - يتم رسم شمعة HTF الحالية مع الفتائل والجسم بشكل صحيح، مع إزاحة عن حركة السعر الحالية
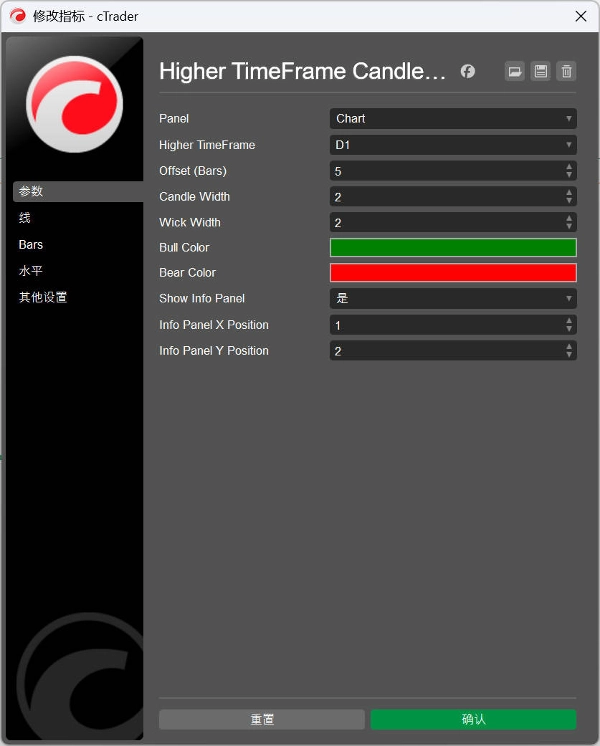
الإعدادات القابلة للتعديل:
- الإزاحة: المسافة بعدد الأشرطة من السعر الحالي (الافتراضي: 5)
- عرض الشمعة: سمك جسم الشمعة (1-10، الافتراضي: 3)
- عرض الفتيل: سمك خطوط الفتيل (1-5، الافتراضي: 1)
- الألوان: ألوان الثور (الأخضر) والدب (الأحمر) القابلة للتخصيص
دعم الإطار الزمني:
- Minute, Minute2, Minute3, Minute4, Minute5
- Minute10, Minute15, Minute30, Minute45
- Hour, Hour4, Hour12
- Daily, Day2, Day3
- Weekly, Monthly
جدول المعلومات - يعرض بيانات شمعة HTF في الوقت الحقيقي: قيم الافتتاح، الأعلى، الأدنى، والإغلاق.
中文说明:
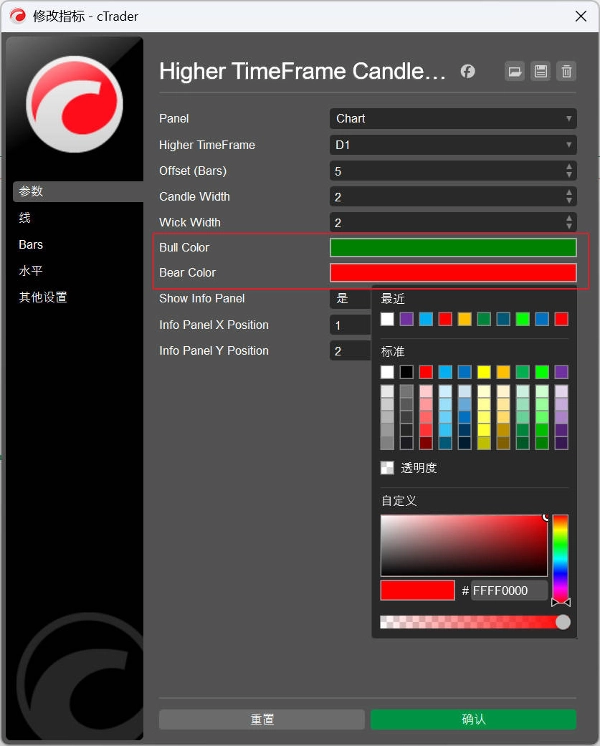
可自定义参数:
- Higher TimeFrame(高时间框架) - 选择要跟踪的时间框架(默认:Daily)
- Offset(偏移量) - K线距离当前价格的位置(默认:5根K线)
- Candle Width(K线宽度) - K线实体的宽度(1-10,默认:3)
- Wick Width(影线宽度) - 影线的宽度(1-5,默认:2)
- Bull Color(看涨颜色) - 看涨K线颜色(默认:Green)
- Bear Color(看跌颜色) - 看跌K线颜色(默认:Red)
- Show Info Panel(显示信息面板) - 是否显示HTF数据面板(默认:true)
الميزات الأساسية:
- عرض شموع HTF في الوقت الحقيقي - رسم شمعة الإطار الزمني الأعلى الحالية على الرسم البياني
- هيكل شمعة كامل - يشمل الجسم، الفتيل العلوي والفتيل السفلي
- تمييز بالألوان - استخدام ألوان مختلفة تلقائيًا حسب الصعود أو الهبوط
- لوحة المعلومات - عرض قيم الافتتاح، الأعلى، الأدنى، الإغلاق واتجاه المؤشر
- تعبئة متكيفة - شموع الثور نصف شفافة، شموع الدب أغمق
الأطر الزمنية المدعومة:
- Minute, Minute2, Minute3, Minute4, Minute5
- Minute10, Minute15, Minute30, Minute45
- Hour, Hour4, Hour12
- Daily, Day2, Day3
- Weekly, Monthly
الملخص
ملف تعريف المؤشر
تقييمات العملاء
0.0
التقييمات: 0
تقييمات العملاء
لا توجد تقييمات لهذا المنتج حتى الآن. هل جرَّبته بالفعل؟ كن أول من يخبر الآخرين!
مناقشة
الأسئلة الشائعة
Prop
Forex
Breakout
Indices
Commodities
Crypto
Stocks
يتم توفير المنتجات المتاحة من خلال cTrader Store، بما في ذلك روبوتات التداول والمؤشرات والإضافات، من قبل مطوري الطرف الثالث وإتاحتها لأغراض الوصول المعلوماتي والفني فقط. cTrader Store ليس وسيطًا ولا يقدم نصائح استثمارية أو توصيات شخصية أو أي ضمان للأداء المستقبلي.


السعر
منذ 30/09/2024
44
المبيعات