
Descripción
Bloque de ruptura CHoCH
https://chartshots.spotware.com/c/69960085a796e
Este indicador está diseñado para traders que operan con Price Action y Conceptos de Dinero Inteligente (SMC) metodologías. Uso recomendado:
- 🔍 Identificar el CHoCH como la primera señal de una posible reversión estructural.
- 👀 Observar la zona de interés generada: es el área a la que el precio suele regresar antes de continuar en la nueva dirección.
- ⏳ Esperar a que el precio regrese a la zona y, dentro de ella, buscar confluencia con niveles de Fibonacci (especialmente 0.382, 0.5, 0.618 y 0.786).
- ✅ Confirmar con una vela envolvente (si está en modo StructureBased) dentro de la zona para una entrada de mayor precisión.
- ❌ La operación queda invalidada si el precio viola el límite opuesto de la zona, ya que el indicador cancela la zona en ese momento.
https://chartshots.spotware.com/c/699600271b05d
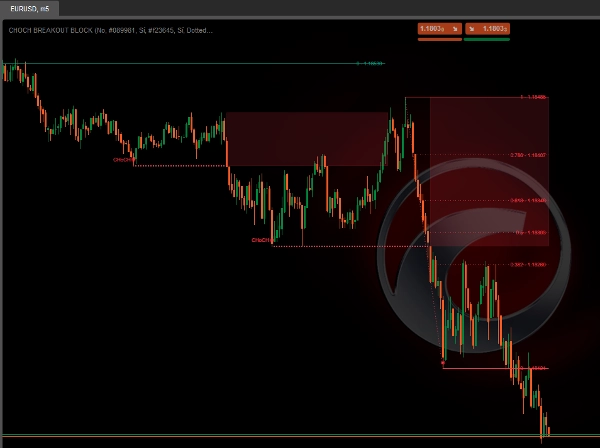
📊 1. Análisis de estructura de tres capas
El indicador analiza el mercado a través de tres niveles jerárquicos anidados, de menor a mayor importancia:
- 🔹 Corto plazo: Detecta los máximos y mínimos locales más recientes comparando tres velas consecutivas. Un mínimo local se confirma cuando la vela del medio es más baja que la anterior y la siguiente. Un máximo local funciona al revés.
- 🔸 Mediano plazo: Se construye sobre los puntos de corto plazo. Cuando los oscilaciones de corto plazo forman un patrón de mínimos más bajos o máximos más altos (lo que significa que tres oscilaciones sucesivas confirman una dirección), se establece un punto de mediano plazo.
- 🔺 Largo plazo: Se construye de la misma manera pero usando los puntos de mediano plazo como base. Esta es la capa más significativa y la que desencadena los eventos principales del indicador.
💡 Esta estructura en cascada asegura que solo los movimientos con peso estructural real generen señales, filtrando el ruido a corto plazo.
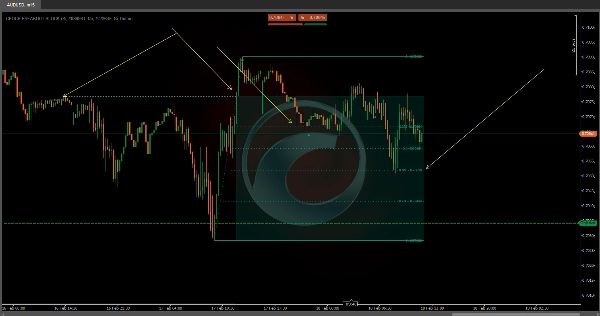
🔄 2. CHoCH — Cambio de Carácter
El CHoCH es el evento central del indicador. Ocurre cuando:
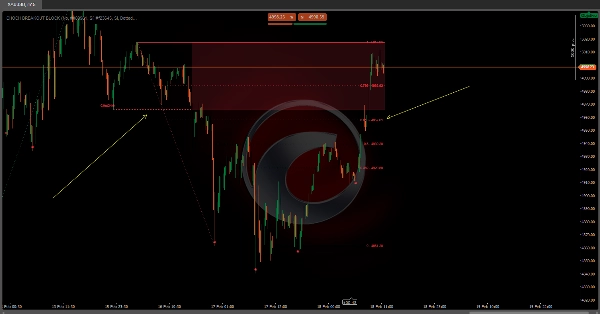
- 🟢 CHoCH alcista: El precio cierra por encima de un máximo estructural previo a largo plazo, mientras que la dirección previa del mercado era bajista. Esto indica que los vendedores han perdido el control y el mercado podría revertir al alza.
- 🔴 CHoCH bajista: El precio cierra por debajo de un mínimo estructural previo a largo plazo, mientras que la dirección previa era alcista. Esto indica que los compradores han perdido el control y el mercado podría revertir a la baja.
Cuando se detecta un CHoCH, el indicador dibuja:
- ➡️ Una línea horizontal en el nivel exacto de ruptura (con el estilo y grosor configurados)
- 🏷️ La etiqueta "CHoCH" encima de esa línea
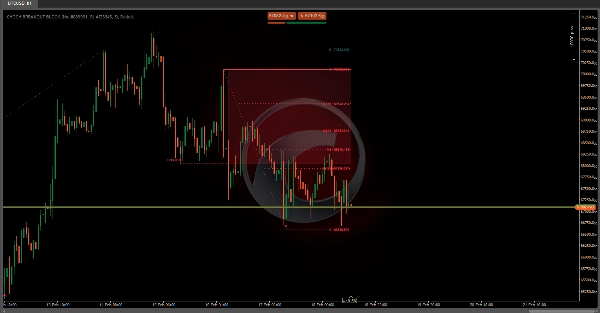
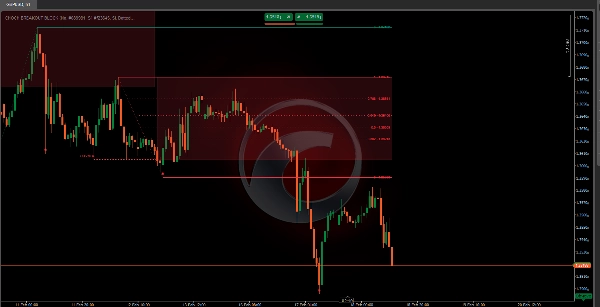
- 🟥🟩 Una zona de interés semitransparente
🗺️ 3. Zona de Interés
Inmediatamente después de un CHoCH, el indicador delimita automáticamente una zona clave de precio:
- 🟢 En un CHoCH alcista: La zona abarca desde el nivel de ruptura (CHoCH) hasta el punto más bajo encontrado entre el swing estructural y el momento de la ruptura. Esta zona representa el área donde el precio podría regresar para buscar liquidez antes de continuar al alza.
- 🔴 En un CHoCH bajista: La zona abarca desde el punto más alto encontrado entre el swing y la ruptura hasta el nivel CHoCH. Representa el área donde el precio podría regresar para buscar liquidez antes de continuar a la baja.
La zona se extiende automáticamente barra a barra mientras el precio respete sus límites. En el momento en que el precio viola el límite opuesto, la zona deja de extenderse — indicando que ha sido probada o invalidada.
👁️ Como se ve en la imagen del gráfico, las zonas rojas semitransparentes representan estas regiones de interés bajistas después de los eventos CHoCH detectados.
📐 4. Niveles automáticos de Fibonacci
Después de detectar un CHoCH, el indicador NO dibuja el Fibonacci inmediatamente. El Fibonacci aparece en una segunda etapa, cuando el mercado confirma que la nueva dirección tiene peso estructural real. Esto ocurre en dos pasos:
Paso 1 — Ocurre el CHoCH: 🏷️ Se dibujan la línea de ruptura, la etiqueta y la zona de interés. El Fibonacci aún no es visible.
Paso 2 — El mercado forma un nuevo swing a largo plazo en la dirección del CHoCH: 📐 Solo en ese momento el indicador proyecta automáticamente los niveles de Fibonacci entre el punto de referencia de la ruptura y ese swing recién confirmado.
📌 Ejemplo: En un CHoCH alcista, el Fibonacci se dibujará desde el punto más bajo encontrado durante la ruptura hasta el primer máximo a largo plazo que el mercado forme después. Si el precio está subiendo pero aún no ha consolidado ese swing estructural, los niveles de Fibonacci no serán visibles todavía — esto es intencional y no un error.
Una vez activos, los niveles se extienden barra a barra mientras la estructura siga siendo válida, y se recalculan automáticamente si aparece una nueva ruptura estructural. Los niveles disponibles son:
Nivel
Significado común
0
Origen del movimiento
Retroceso menor
⭐ Primer retroceso relevante
0.5
⭐ Nivel medio
⭐ Proporción áurea
Variante de la proporción áurea
⭐ Retroceso profundo
1
Extensión del 100%
🕯️ 5. Detección de vela envolvente
El indicador incluye detección de patrones de vela envolvente como señal adicional de confluencia:
- ▲ Una envolvente alcista aparece cuando una vela verde grande absorbe completamente una vela roja pequeña previa.
- ▼ Una envolvente bajista aparece cuando una vela roja grande absorbe completamente una vela verde pequeña previa.
Hay dos modos de visualización:
- 📋 Todos: Muestra todos los patrones envolventes que aparecen en el gráfico.
- 🎯 Basado en estructura: Solo muestra patrones envolventes que ocurren dentro de una zona de interés activa, aumentando significativamente la relevancia de la señal.
Resumen
When a CHoCH occurs, the indicator marks the breakout level with a horizontal line and label, and automatically creates a semi-transparent interest zone where price is likely to return before continuing in the new direction. This zone extends dynamically as long as price respects its boundaries and is invalidated if price breaks the opposite boundary.
The indicator also projects Fibonacci retracement levels automatically after the market confirms the new trend direction by forming a new long-term swing. Supported Fibonacci levels include 0.236, 0.382, 0.5, 0.618, 0.65, 0.786, and 1. Additionally, it detects bullish and bearish engulfing candle patterns as confluence signals, with options to display all patterns or only those occurring within active interest zones for higher precision.
This tool supports multiple markets including BTCUSD, EURUSD, GBPUSD, NZDUSD, XAUUSD, NAS100, and USDJPY.
Valoraciones de clientes
5 | 100 % | |
4 | 0 % | |
3 | 0 % | |
2 | 0 % | |
1 | 0 % |


