
Descripción
Indicadores de Pinescriptlabs Store: Pinescriptlabs Store cBots : (cBot) Gold & BTC BreakoutSession Pivots(nuevo)
Proyección de Liquidez de Precio ZigZag
Algoritmo Inteligente de Seguimiento (nuevo)
Mapa de Liquidación de Apalancamiento
Predicción Basada en Linreg y ATR
Soporte y Resistencia SmartTrend
Líneas
Lines
Sesiones de Brecha de Valor Justo
Análisis
Dinámico de Estructura
de Mercado
de
Puntos
de Giro
Regresión
Lineal
de Fibonacci
Multitemporal
Brecha de Valor Justo de Momentum
Proyección de Flujo de Mercado
Gradiente de Tendencia Dinámico
Rastreador
de Sesgo
de Vela Multinivel
Rastreador de Extremos Zig-Zag
Líneas
Automáticas de Soporte y
Resistencia
de Tendencia
Lines
Todos
los Niveles de
Soporte y
Resistencia
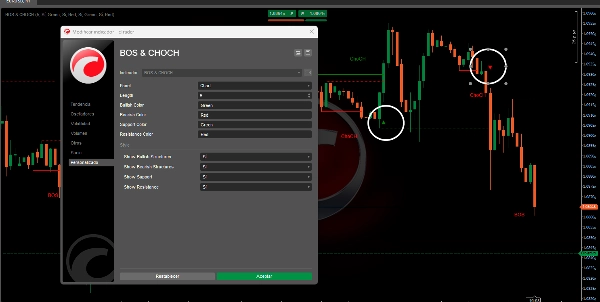
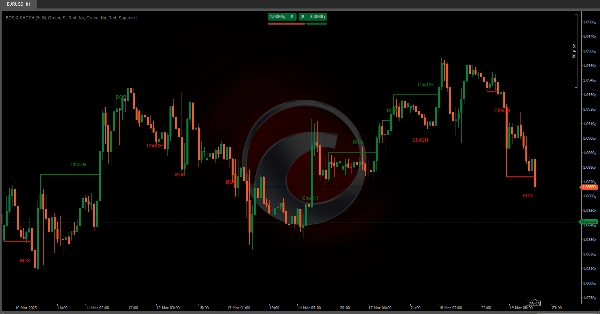
El algoritmo está diseñado para identificar patrones estructurales del mercado , específicamente los conceptos de Cambio de Carácter (ChoCH) 🔄 y Ruptura de Estructura (BoS) 💥. A continuación, explicaré en detalle qué hace este algoritmo, su propósito y cómo identifica estos dos conceptos.
¿Qué Hace el Algoritmo?
El algoritmo utiliza fractales (máximos y mínimos locales) para determinar si el precio ha cambiado su comportamiento o ha roto una estructura previamente establecida. A continuación, las funcionalidades principales:
Detección de Fractales 📊
- Un fractal alcista ocurre cuando hay un máximo local donde las velas a ambos lados son más bajas. 📈
- Un fractal bajista ocurre cuando hay un mínimo local donde las velas a ambos lados son más altas. 📉
- Estos fractales actúan como puntos de referencia para identificar cambios en la estructura del mercado.
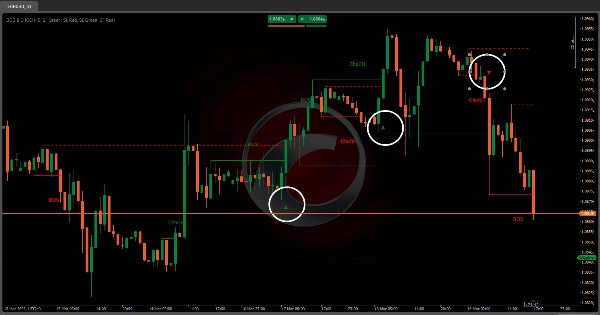
Identificación de ChoCH (Cambio de Carácter) 🔄
- Un ChoCH alcista ocurre cuando el precio supera un fractal alcista sin formar una estructura bajista completa antes.
- Un ChoCH bajista ocurre cuando el precio cae por debajo de un fractal bajista sin formar una estructura alcista completa antes.
- Esto indica que el mercado ha cambiado su carácter (de tendencia a consolidación o viceversa).
Identificación de BoS (Ruptura de Estructura) 💥
- Un BoS alcista ocurre cuando el precio supera un fractal alcista después de formar una estructura bajista completa antes.
- Un BoS bajista ocurre cuando el precio cae por debajo de un fractal bajista después de formar una estructura alcista completa antes.
- Esto indica que el mercado ha roto una estructura previamente establecida, lo que puede ser un punto importante de entrada o salida.
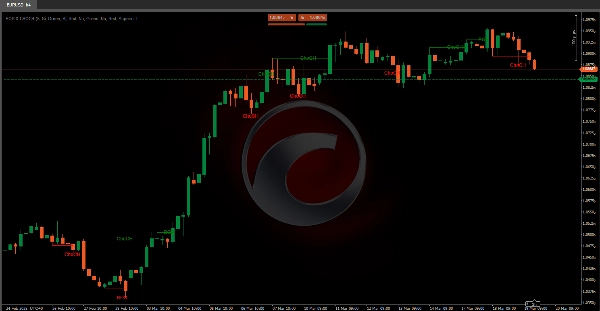
Visualización de Soporte y Resistencia 🛡️
- El algoritmo puede dibujar líneas de soporte y resistencia basadas en los fractales detectados.
- También verifica si estas líneas son rotas, marcando los puntos de ruptura con íconos visuales.
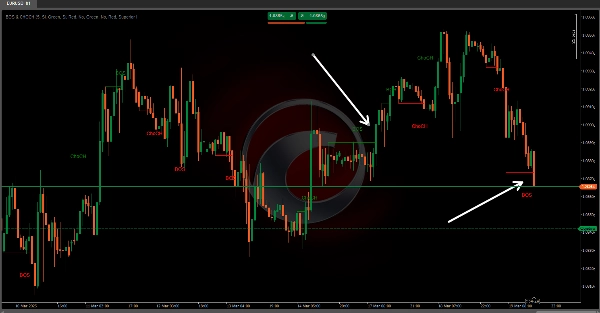
Este algoritmo proporciona a los traders información valiosa sobre el comportamiento del mercado al identificar claramente cambios estructurales clave y oportunidades potenciales de ruptura. Al aprovechar ChoCH 🔄 y BoS 💥 señales, los traders pueden tomar decisiones más informadas sobre entradas, salidas y la dinámica general del mercado.
Resumen
Key functionalities include:
- **Fractal Detection:** Identifies bullish fractals (local highs with lower candles on both sides) and bearish fractals (local lows with higher candles on both sides).
- **Change of Character (ChoCH):** Signals when the market changes its behavior, such as shifting from trend to consolidation, by surpassing fractals without forming a complete opposite structure.
- **Break of Structure (BoS):** Indicates when the market breaks a previously established structure, marking potential entry or exit points.
- **Support and Resistance Visualization:** Draws support and resistance lines based on fractals and marks breakout points with visual icons.
This indicator aids traders in understanding market dynamics by clearly highlighting structural changes and breakout opportunities, supporting more informed trading decisions.
Valoraciones de clientes
5 | 100 % | |
4 | 0 % | |
3 | 0 % | |
2 | 0 % | |
1 | 0 % |


