
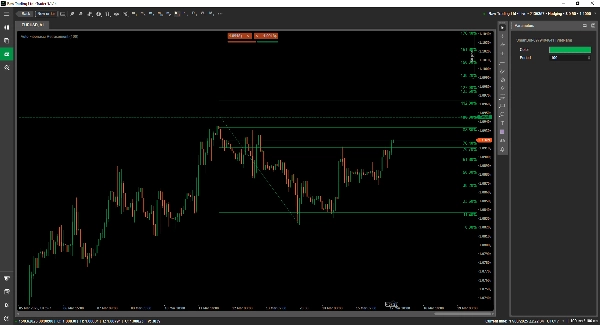
Auto Fibonacci Retracement
Indicador
1 compras
Versión 1.0, Mar 2025
Windows, Mac
4.0
Valoraciones: 1
Descripción
Presentamos el Indicador de Retroceso de Fibonacci Automático para cTrader Transforma tu experiencia de trading con el innovador Indicador de Retroceso de Fibonacci Automático, diseñado exclusivamente para cTrader. Esta herramienta automatiza el proceso de dibujar retrocesos de Fibonacci directamente en tus gráficos, ahorrándote tiempo y asegurando precisión. Al identificar sin problemas niveles clave, ayuda a los traders a localizar puntos potenciales de entrada y salida con precisión. Ya seas un trader experimentado o estés comenzando, el indicador de Retroceso de Fibonacci Automático te permite tomar decisiones de trading más informadas y con confianza. ¡Mejora tu estrategia de trading hoy mismo!
Resumen
Perfil del indicador
Valoraciones de clientes
4.0
Valoraciones: 1
5 | 0 % | |
4 | 100 % | |
3 | 0 % | |
2 | 0 % | |
1 | 0 % |
Valoraciones de clientes
March 21, 2025
It helped mostly by making bad ideas easier to skip. The setup needs patience.
Conversación
Preguntas frecuentes
Los productos disponibles a través de cTrader Store, incluidos bots, indicadores y plugins para operar, son proporcionados por desarrolladores de terceros y están disponibles únicamente con fines informativos y de acceso técnico. cTrader Store no es un bróker, por lo que no proporciona asesoramiento de inversión, recomendaciones personales ni ninguna garantía de rentabilidad futura.


Precio
Desde 29/11/2024
32
Ventas
975
Instalaciones gratis