
คำอธิบาย
มันระบุพื้นที่ที่ตลาดไม่สมดุล (ช่องว่างมูลค่ายุติธรรม หรือ FVGs) และแสดงผลบนแผนภูมิอย่างชาญฉลาด แตกต่างจากตัวชี้วัดอื่น ๆ ตัวนี้ปรับตัวแบบเรียลไทม์ตามการเคลื่อนไหวของราคา โดยปรับขนาด ความคงทน และความเกี่ยวข้อง เหมาะสำหรับเทรดเดอร์ที่ต้องการเป้าหมายที่ชัดเจนและการจัดการช่องว่างด้วยภาพขั้นสูง
✨ คุณสมบัติหลัก
- การปรับช่องว่างแบบไดนามิก
ตรรกะ: หากราคาสัมผัสบางส่วนของ FVG (เช่น แตะขอบล่าง) ตัวชี้วัดจะปรับขนาดช่องว่างโดยอัตโนมัติเพื่อแสดงเฉพาะพื้นที่ที่ยังไม่ถูกครอบคลุม
ประโยชน์: หลีกเลี่ยงสัญญาณเท็จและเก็บเฉพาะช่องว่างที่มีศักยภาพจริงไว้เท่านั้น - การเติมจุดกึ่งกลาง
ตรรกะ: วาดเส้นที่กึ่งกลางของช่องว่าง หากราคาสัมผัสเส้นนี้ FVG จะถือว่า "เติมเต็ม" และสามารถลบออกได้ (ตั้งค่าได้)
ประโยชน์: ต้องการเพียงการสัมผัส 50% เพื่อยืนยันการปิด กรองเสียงรบกวนและการเทรดก่อนเวลา - การฉายภาพไม่สิ้นสุดจนกว่าจะเติมเต็ม
ตรรกะ: ช่องว่างขยายไปในอนาคตอย่างไม่มีกำหนด (ไม่หายไปหลังจากเทียน X แท่ง)
ประโยชน์: ให้การอ้างอิงที่ต่อเนื่องจนกว่าตลาดจะแก้ไขความไม่สมดุล - การล้างข้อมูลอัตโนมัติของช่องว่างที่ไม่ถูกต้อง
ตรรกะ: ลบช่องว่างเก่าโดยอัตโนมัติเมื่อถูกเติมเต็มทั้งหมด
ประโยชน์: รักษาความสะอาดของแผนภูมิและเน้นพื้นที่ที่ยังใช้งานอยู่ - การปรับแต่งภาพขั้นสูง
ตัวเลือก: สีที่แตกต่างสำหรับช่องว่างขาขึ้น (สีเขียว) และขาลง (สีแดง) การปรับความโปร่งใสเพื่อหลีกเลี่ยงความรกบนแผนภูมิ
ประโยชน์: ปรับให้เข้ากับสไตล์การเทรดหรือกลยุทธ์ภาพใดก็ได้
🎯 วิธีใช้ในเทรดดิ้ง?
การระบุโซนสำคัญ:
- FVG ขาขึ้น (สีเขียว): พื้นที่ที่ผู้ซื้อสูญเสียแรงชั่วคราว
→ กลยุทธ์: มองหาโอกาสซื้อในช่วงราคาย่อตัวกลับมายังโซนนี้ - FVG ขาลง (สีแดง): พื้นที่ที่ผู้ขายถูกแซง
→ กลยุทธ์: มองหาโอกาสขายในช่วงราคาขึ้นไปยังโซนนี้
การโต้ตอบกับราคา:
- ถ้าช่องว่างปรับขนาดแบบไดนามิก (ลดขนาด) หมายความว่าตลาดกำลังทดสอบโซนแต่ยังไม่มีการยืนยัน
- ถ้าช่องว่างถูกลบออก (โดยการเติมเต็มทั้งหมดหรือจุดกึ่งกลาง) ให้พิจารณาว่าความไม่สมดุลได้รับการแก้ไขแล้ว
🔍 การยืนยันด้วยเครื่องมืออื่น ๆ
ผสมผสาน FVGs กับแนวรับ/แนวต้าน ปริมาณ หรือ RSI เพื่อกรองสัญญาณ
📋 การเปรียบเทียบคุณสมบัติ
___________________________________________________________________________________
คุณสมบัติ Momentum Fair Value Gap Traditional Indicators
________________________________________________________________________________
ความคงทน---------------- ขยายช่องว่างจนกว่าจะเติมเต็ม ----------------------- หายไปหลังจากเทียน X แท่ง
ความแม่นยำในการปิด-------- ตัวเลือกยืนยัน 50% --------------------- ต้องเติมเต็มช่องว่างทั้งหมด
ความยืดหยุ่น ------------------ ปรับขนาดตามราคา ------------------------- ระดับคงที่และไม่เปลี่ยนแปลง
จุดสนใจทางสายตา---------------- ลบช่องว่างที่ไม่เกี่ยวข้อง ----------------------- ทำให้แผนภูมิดูรกด้วยข้อมูลเก่า
📝 ตัวอย่างใช้งานจริง
สถานการณ์ใน EURUSD (1H):
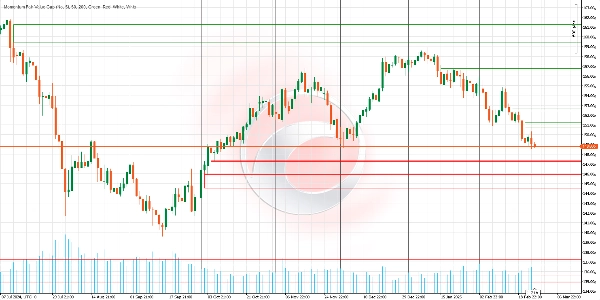
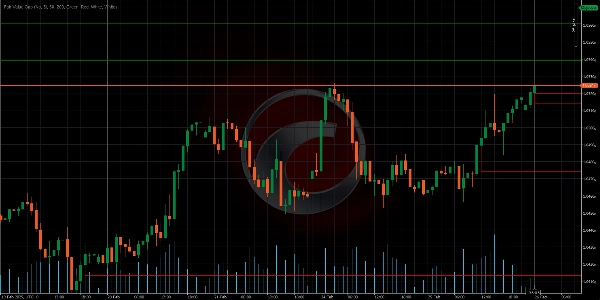
FVG ขาขึ้น (สีเขียว) ก่อตัวหลังจากแท่งเทียนขาลงที่ชัดเจน หลายวันต่อมา ราคาย้อนกลับ แตะขอบล่างของช่องว่างแต่ไม่เติมเต็ม ตัวชี้วัดจะลดขนาดช่องว่างโดยอัตโนมัติ สุดท้ายราคาสัมผัสจุดกึ่งกลาง (เส้นกลาง) ทำให้ลบช่องว่างออก เทรดเดอร์เปิดสถานะขายหลังยืนยันการปฏิเสธในโซนนี้
ตัวชี้วัดร้านค้า Ctrader:
Dynamic Market Structure
Analysis of Turning Points
Fibonacci Linear
Regression Multi-timeframe
Multi-Level Candle Bias
Tracker
Auto Support and
Resistance Trend Lines
สรุป
Key features include:
- Dynamic Gap Adjustment: Automatically resizes gaps when price partially touches them, reducing false signals.
- MidPoint Fill: Marks the gap centerline; if price touches it, the gap is considered filled and can be removed, requiring only 50% contact for confirmation.
- Infinite Projection: Gaps extend indefinitely until filled, maintaining persistent market imbalance references.
- Automatic Cleanup: Removes fully filled gaps to keep charts focused on active zones.
- Advanced Visual Customization: Uses distinct colors for bullish (green) and bearish (red) gaps with adjustable transparency.
In trading, bullish FVGs indicate zones where buyers lost strength, suggesting buying opportunities on pullbacks; bearish FVGs mark where sellers were overtaken, indicating selling opportunities on rallies. The indicator’s dynamic interaction with price helps confirm market imbalance resolution.
It is recommended to combine this indicator with other tools like support/resistance levels, volume, or RSI for signal filtering.
รีวิวจากลูกค้า
5 | 0 % | |
4 | 100 % | |
3 | 0 % | |
2 | 0 % | |
1 | 0 % |


