"Trailing Smart Algorithm" 로고
지표
버전 1.0, Jul 2025
Windows, Mac
5.0
리뷰: 1
"Trailing Smart Algorithm" 업로드된 이미지
가입일 03/10/2024
152
판매
35.57K
무료 설치

트레일링 스마트 알고리즘

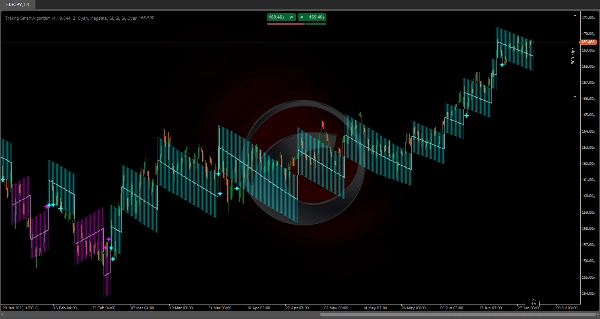
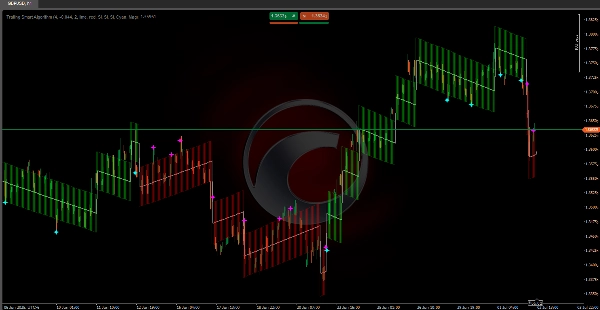
https://chartshots.spotware.com/c/69f0f1d89000b

특정 시장 상황에서 가격을 일관되게 추적하도록 설계된 수학적 알고리즘 🧠 을 통합합니다. 🌐
계산 구조는 추세선이 항상 가격 움직임과 동기화되도록 하여 전통적인 지표의 일반적인 지연을 피합니다 ⏳.

기존 알고리즘과 달리, 이 시스템은 정확한 변동성 측정 📊 을 사용하고 자동 조정 ⚙️ 을 적용하여 최적의 추적을 보장합니다. 내부 계산은 빠른 움직임 ⚡ 과 점진적인 추세 발전 🕊️ 동안에도 시장 방향을 정확하게 표현 하도록 설계되었습니다.

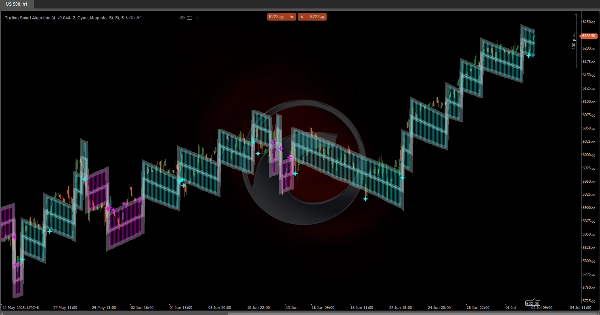
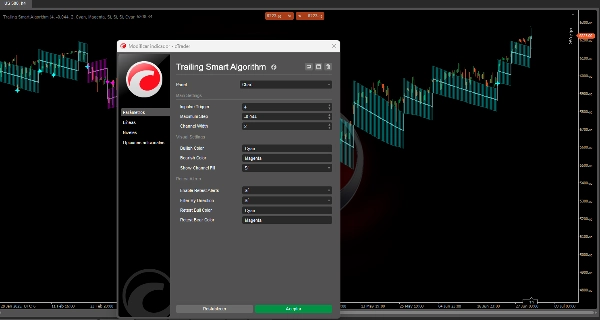
https://chartshots.spotware.com/c/69f0f218591b0

💡 작동 원리

이 지표는 지배적인 추세 방향으로 움직이는 적응형 단계 시스템 을 사용합니다.
다음의 세 가지 주요 구성 요소 에 기반합니다:

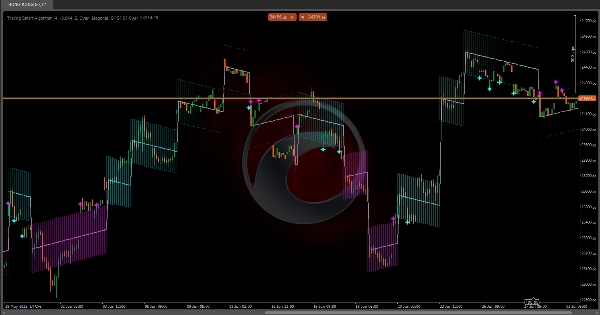
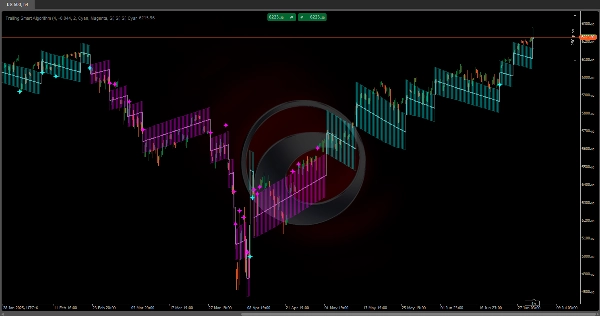
https://chartshots.spotware.com/c/69f0f2b19e4d3

1️⃣ 추세 변화 감지
시스템은 특정 임계값을 초과하는 중요한 움직임을 감지하기 위해 가격을 지속적으로 모니터링합니다 (임펄스 트리거 🎯).
가격이 현재 추세선에서 충분히 멀어지면, 지표는 잠재적 방향 변화 를 인식하고 주요 선을 재배치합니다.
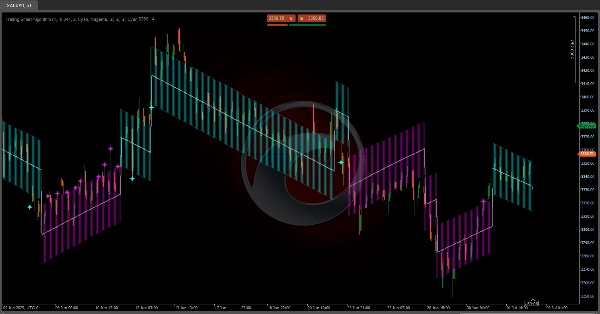

2️⃣ 동적 트레일링
방향이 설정되면, 추세선은 시장과 같은 방향으로 단계별로 🪜 움직입니다.
각 단계는 현재 변동성 (ATR 📈) 에 따라 계산됩니다:
더 변동성이 큰 시장 에서는 단계가 더 큽니다 🌊
더 조용한 시장 에서는 단계가 더 작습니다 🌿


3️⃣ 변동성 채널
주요 선 주위에 채널(상한선 및 하한선)이 형성되어 정상 변동성 구역 📉📈 을 나타냅니다.
이 채널은 가격이 정상 범위 내에서 움직이는지 또는 극단적인 움직임 🚨 을 하는지 식별하는 데 도움을 줍니다.


📏 변동성 채널

상한선: 변동성 채널의 상한
하한선: 변동성 채널의 하한


✨ 재테스트 신호

청록색 별 🌟: 상승 추세 동안 가격이 하한선을 터치하거나 교차할 때
마젠타 별 ⭐: 하락 추세 동안 가격이 상한선을 터치하거나 교차할 때


⚙️ 매개변수 설정

🔹 주요 매개변수

임펄스 트리거 (기본값: 4)
기능
추세 변화를 감지하는 민감도 를 결정합니다. 가격이 방향 변화를 유발하기 위해 얼마나 움직여야 하는지를 정의하는 ATR 배수입니다.

수정 시 영향:
높은 값 (5–8):

  • 추세 변화에 더 강함 🛡️
  • 거짓 신호 감소
  • 실제 변화에 대한 반응 느림

낮은 값 (2–3):

  • 민감도 증가 🎯
  • 반응 속도 빠름
  • 횡보 시장에서 거짓 신호 발생 가능성 증가


최대 단계 (기본값: -0.044)
기능
추세선이 취할 수 있는 각 단계의 최대 크기 를 제한합니다. 음수 값으로 상한 역할을 합니다.

수정 시 영향:
덜 음수 (-0.020 ~ -0.030):

  • 더 큰 단계 🚀
  • 더 공격적인 추세 추적

더 음수 (-0.050 ~ -0.080):

  • 더 작고 점진적인 단계 🌱
  • 더 보수적인 추적


채널 너비 (기본값: 2)
기능
주요 선 주위의 변동성 채널 너비 를 정의합니다.

수정 시 영향:
높은 값 (3–4):

  • 더 넓은 채널 🟢
  • 재테스트 신호 감소
  • 변동성에 대한 더 큰 허용치

낮은 값 (1–1.5):

  • 더 좁은 채널 🔴
  • 재테스트 신호 증가
  • 노이즈에 대한 민감도 증가


🎨 시각적 매개변수

강세 색상 / 약세 색상
각각 상승 추세와 하락 추세 의 색상을 정의합니다.

채널 채우기 표시
변동성 채널의 시각적 채우기 를 활성화하거나 비활성화합니다 🌈.


🔔 재테스트 설정

재테스트 알림 활성화
가격이 채널 밴드를 터치할 때 재테스트 신호를 토글합니다.

방향별 필터
활성화 시, 현재 추세와 일치하는 재테스트 신호만 표시 합니다:
상승 추세: 하한선에서만 신호 표시
하락 추세: 상한선에서만 신호 표시


🌟 재테스트 신호 요약

하한선의 청록색 별: 동적 지지에서의 잠재적 강세 반등
상한선의 마젠타 별: 동적 저항에서의 잠재적 약세 반등

지표 프로필
지표 카테고리
추세
출력 유형
시각화
신호
데이터 요구 사항
막대만
지원되는 신호
레벨 돌파
레벨 터치
돌파
5.0
리뷰: 1
5
100 %
4
0 %
3
0 %
2
0 %
1
0 %
고객 리뷰
July 12, 2025
A calm trader gets value from the decision feels less rushed. The stop still matters.
BTCUSD
Breakout
Supertrend
Crypto
XAUUSD
Market Structure
ATR
트레이딩 봇, 지표, 플러그인 등 cTrader Store에서 제공되는 상품은 제3자 개발자에 의해 제공되며, 이는 단순히 정보 및 기술적 접근을 목적으로 제공된 것입니다. cTrader Store는 중개인이 아니며, 투자 조언, 개인별 추천 또는 향후 성과에 대한 어떠한 보장도 제공하지 않습니다.

이 작성자의 상품 더 보기

"ZigZag" 로고
최고 평점
4.3
(6)
무료
지표
ATR
RSI
+7
ZigZag filters noise, spots trends, patterns, pivots, aiding analysis, trade management, and confirmations. 📉📈
지표
ATR
RSI
+7
Identify bullish and bearish Order Blocks to spot key support/resistance levels and potential trend reversals! 📈🔄
지표
ATR
RSI
+7
📊 Shows volume by price levels, highlights POC, and key zones. Identifies dynamic support/resistance and imbalances.
지표
ATR
RSI
+6
Market structural patterns , specifically the concepts of Change of Character (ChoCH) 🔄 and Break of Structure (BoS) 💥
지표
ATR
RSI
+6
Adaptive trend channel using linear regression and Pearson correlation for dynamic support, resistance, and trends.
지표
RSI
Breakout
+1
"Identify key market zones and visualize support/resistance from multiple timeframes on a single chart.
지표
ATR
RSI
+7
identify and highlight temporary market inefficiencies known as "fair value gaps" 🚨 within specific trading Sessions.
지표
ATR
RSI
+6
💹 Define a price channel 📈 and determine trend direction (bullish 🟢 or bearish 🔴).
지표
ATR
RSI
+6
📊Zones Supply & Demand: Identifies key price levels with high volume concentration, marking Supply/Demand Zones & Marke
지표
RSI
BTCUSD
+5
Identify market structure effortlessly with swing highs, lows, CHoCH, and BOS levels for smart trading decisions! 📊🔍"
지표
ATR
RSI
+8
Detects bullish and bearish divergences
지표
Advanced price action tool that combines multiple technical analysis concepts

좋아하실 만한 다른 항목

지표
SMC
Prop
+16
Multi-Time Frame Candlesticks FVG with BSL/SSL Premium Suite
지표
Prop
Forex
+13
Volume Meter
지표
EMA
RSI
+5
MACD Colour Histogram with 11 Moving Average Types, Multi-timeframe confirmation and Sound Signal Alert.
지표
SMC
Prop
+17
Unlock the true intent of market participants with the Classic Proportional Cumulative Volume Delta CVD!
지표
SMC
Prop
+13
Tracks virgin levels. Lines vanish only after a candle closes beyond the high/low on your chosen timeframe.
지표
AI
ATR
+27
WICK COMMANDER — Know Exactly When the Market Commits
지표
Flag
Key Levels
+5
Zig Zag filters out minor price noise and connects only the most significant swing and lows for key turning points.
지표
Forex
Crypto
+3
Day of Week Indicator for cTrader
지표
ATR
RSI
+5
Visual indicator for identifying momentum reversals. Designed for forex (1h) and stocks (weekly).
지표
Overlay HTF context on any chart: color bars by HTF and draw filled HTF bodies with optional High/Low lines.
지표
Prop
Forex
+3
Price Change Bundle 3-in-1 Levels • Bars • Histogram. Secret of Price Change
지표
ADX
ATR
+5
Identify high-probability weeks before they happen. Quarterly cycles + weekly bias across 8 instruments, live.
지표
MSS
Market Structure
NY HTF Candles is a precision panel designed specifically for institutional traders
지표
Forex
Indices
+1
The Floating Risk Indicator is an essential tool for traders who prioritize risk management.
지표
MACD
Prop
+14
Enhance MACD Histogram! Visualize bull and bear price changes with vibrant colors for clearer, more insightful trading.
지표
ATR
RSI
+7
Identify bullish and bearish Order Blocks to spot key support/resistance levels and potential trend reversals! 📈🔄
지표
Forex
Multi-timeframe candlesticks!
지표
Forex
EURUSD
+4
Check the correlations between dozens of assets in one elegant display.
가입일 03/10/2024
152
판매
35.57K
무료 설치