
説明
📊 COTインジケーター履歴Pro — アクターフロー+方向性(機関投資家 / ヘッジャー / 小口投資家)
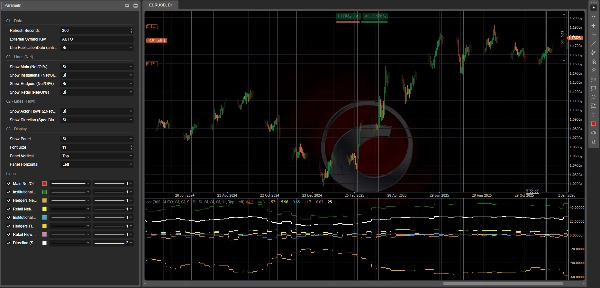
CotIndicatorHistoryPro は、取引参加者別(機関投資家、ヘッジャー/商業、個人投資家)の明確な内訳とともに、チャート上に直接高度な取組高報告(COT)を表示します。
それは単に 各アクターのポジション(主にロング/ショート)を示すだけでなく、現在彼らが何をしているか(ロングまたはショートの増加)、さらに合成された方向性ラインで優勢なバイアスを強調します。
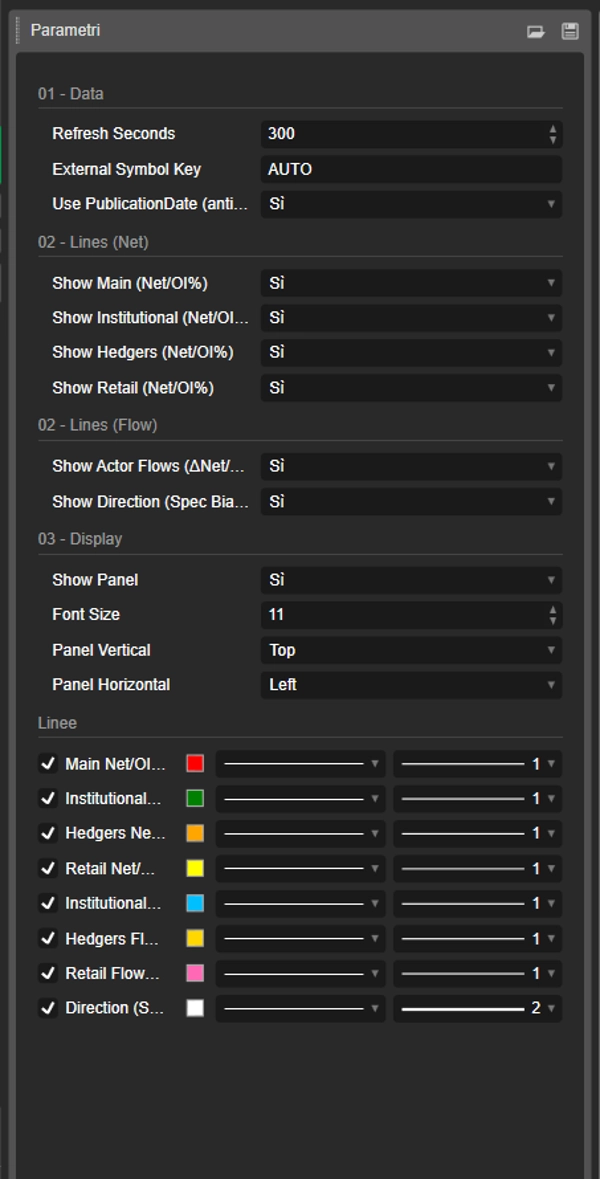
インジケーターは 安全なJSONフィード(履歴+出力)からデータセットを読み込み、チャート上に安全に整列させます(PublicationDateを使用した先読み防止オプション)。
🗓️ 週間データ更新(毎週金曜21:00)
COTデータセットは 毎週金曜21:00(ヨーロッパ/ローマ時間)に更新されます。専用の自動化パイプラインによるものです:
高度な処理スクリプトが計算を実行し、更新された値をJSONフィードに公開します。このフィードはインジケーター(および関連するcBotエコシステムがインストールされている場合)で使用されます。
✅ インジケーター自体はプラットフォーム上で リフレッシュ秒数設定を使って更新され、公開され次第新しい週間データを表示します。
✅ 取得できるもの(ライン+パネル)
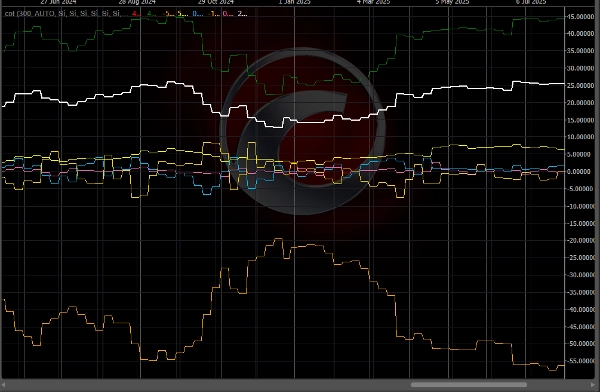
🔥 “フロー” ライン(3アクター) — Δネット/OI%
これらのラインは 週ごとのネットポジションの変化を表し、オープンインタレストで正規化されています:
- 🔵 機関投資家フロー(Δネット/OI%)
- 🟡 ヘッジャー/商業フロー(Δネット/OI%)
- 💗 個人投資家フロー(Δネット/OI%)
📌 読み方:
- 0以上 ⇒ アクターは ネットロングを増加中(ロングを追加またはショートをカバー)
- 0未満 ⇒ アクターは ネットショートを増加中(ショートを追加またはロングを削減)
- 絶対値が大きいほど(例:±1.5%、±3%) ⇒ より強く意味のあるポジション変化
🧭 “方向性” ライン — 投機バイアス ネット/OI%
- ⚪ 方向性(投機バイアス)ネット/OI%は優勢な「投機的」方向性を要約します(機関投資家+個人投資家の平均、必要に応じて代替あり)。
📌 読み方:
- > 0 ⇒ 投機的バイアスは ロング
- < 0 ⇒ 投機的バイアスは ショート
- ≈ 0 ⇒ フラット/中立フェーズ
🧩 情報パネル(全体コンテキスト)
組み込みパネルには以下が表示されます:
- 📄 レポート日/公開日
- 📌 オープンインタレスト+週次変化(WoW)
- 🎯 テキストシグナル(OUTPUTにある場合)
- 各アクターごとに:
-
- バイアス(主にロング/ショート/フラット)を ネットに基づいて表示
- ネット/OI%
- フロー(Δネット/OI%)
- 週次Δロング/Δショート/Δネットで どのようにポジションが変化したかを理解
🧠 読み方(シンプル&実用的)
✅ フローとバイアス(主な違い)
- フロー=現在彼らがしていること(ロングまたはショートの追加)
- バイアス=全体的なポジションの傾向(主にロングまたはショート)
例:
- 機関投資家 バイアスロング+ポジティブフロー ⇒ まだロングを押し進めている
- 機関投資家 バイアスロング+ネガティブフロー ⇒ ロングの削減/回転の可能性
🚦 典型的な取引シナリオ
✅ シナリオA — トレンド確認
- 方向性 > 0
- 機関投資家フロー > 0
➡️ ロング圧力が一貫しており、多くの場合継続のセットアップ。
✅ シナリオB — 反転の可能性(スマートマネー対個人投資家)
- 機関投資家フロー > 0 一方、個人投資家フロー < 0
➡️ 個人投資家は売り/ショート、機関は買い:蓄積の可能性。
(逆は分配の可能性)
✅ シナリオC — ヘッジャーによる「警告」
- ヘッジャーが極端なレベル(ネット/OIが中立から大きく離れている)+強いフロー
➡️ 過剰ゾーンまたは積極的なヘッジの可能性(直接のエントリートリガーより警告として有効なことが多い)。
✅ シナリオD — 市場の「積み増し」(ブレイクアウトリスク)
- 強いフロー+オープンインタレストの週次増加
➡️ 新規ポジションが入り、拡大した動きの可能性が高まることが多い。
⚡ 10秒で読むルーチン
- 方向性を確認:ロング(>0)かショート(<0)か
- 機関投資家フローを確認:一致しているか、乖離しているか?
- 個人投資家フローを確認:一致しているか、それとも逆か?
- オープンインタレストの週次変化を確認:拡大かポジション解消か?
✅ 対応シンボル+主要凡例(JSONシンボルキー)
インジケーターは JSONフィード内の任意の銘柄(OUTPUTのフィールド data[].symbol)を分析できます。
正しい銘柄の選び方
- 外部シンボルキー = AUTO 👉 チャートのシンボルを自動的に使用し、「.」以降のサフィックスを削除します(例:
US2000.ecn→US2000)。 - ブローカーが異なるシンボル名を使う場合は 👉 外部シンボルキーを正確なJSONキーに設定してください(大文字小文字は区別しません)。
現在のフィード内キー(例:レポート日 2026-02-17、公開日 2026-02-20)
- FX:
AUDUSD、EURUSD、GBPUSD、USDMXN - 指数:
US100、US2000、DOW30、VIX - 商品/金属/農産物:
BRENT、WTI、COPPER、CORN、WHEAT、XAU(ゴールド)、XAG(シルバー) - 暗号通貨:
BTC、ETH
📌 チャートに値が表示されない場合:
- チャートのシンボルがJSONキーと一致しているか確認してください
- 外部シンボルキーを手動で設定してください(例:
ETH、US2000) - パネルの レポート日/公開日を確認し、最新のデータセットが読み込まれているか確認してください
⚙️ 注意事項
- より安全な整列をサポート(PublicationDate使用(先読み防止))✅
- ラインとパネルは個別に有効/無効にできます。
📌 免責事項:情報提供のみのインジケーターであり、金融アドバイスではありません。COTデータは週次であり、トレンド、重要レベル、ボラティリティと合わせて文脈化する必要があります。
概要
The indicator sources data from a secured JSON feed updated every Friday at 21:00 (Europe/Rome time) and aligns it on the chart using publication dates to prevent lookahead bias. Users can view flow lines for each actor, a direction line indicating overall market bias, and an info panel detailing report dates, open interest, net positions, and weekly changes.
It supports a wide range of instruments including Forex pairs (e.g., EURUSD, GBPUSD), indices (e.g., US100, DOW30), commodities (e.g., Brent, Gold), and cryptocurrencies (BTC, ETH). Symbol selection can be automatic or manually set to match feed keys.
Typical use cases include trend confirmation, spotting potential reversals by comparing smart money and retail flows, hedger activity alerts, and breakout risk assessment based on open interest changes. The indicator is informational and designed to complement other technical analysis tools.
カスタマーレビュー
5 | 50 % | |
4 | 50 % | |
3 | 0 % | |
2 | 0 % | |
1 | 0 % |


