

Fixed Range Volume Profile Auto-last swing move
Indicator
Version 1.0, Jul 2026
Windows, Mac
Trading product for Fixed Range Volume Profile  Auto-last swing move Indicator Fibonacci Key Levels, image 2
Trading product for Fixed Range Volume Profile  Auto-last swing move Indicator Fibonacci Key Levels, image 3
Trading product for Fixed Range Volume Profile  Auto-last swing move Indicator Fibonacci Key Levels, image 4
Since 14/01/2025
1
Sales
123
Free installs

Description

SWING VOLUME PROFILE (SVP)

Swing-Based Volume Profile + Fibonacci + RSI


--------------------------------------------------


Swing detection. Volume profile. Fibonacci. RSI. All-in-one.


--------------------------------------------------


WHAT THIS INDICATOR DOES


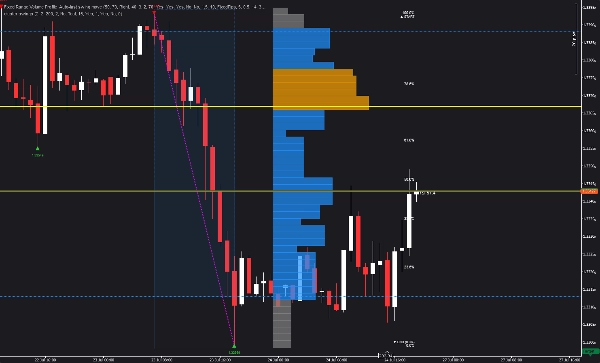
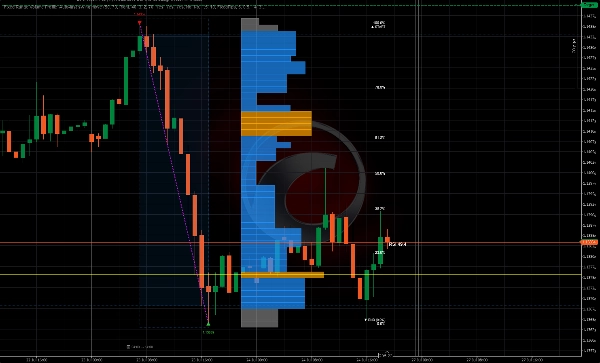
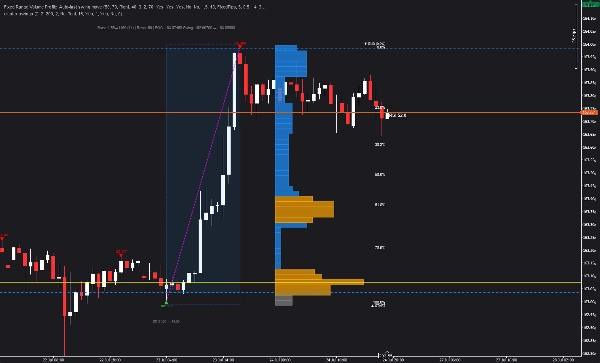
Swing Volume Profile (SVP) automatically detects structural swings and displays a volume profile for the most recent completed swing β€” with Fibonacci retracement and RSI overlay.


No manual range selection needed. The indicator finds the swings and builds the profile automatically.


--------------------------------------------------


KEY FEATURES


- AUTO-SWING DETECTION (configurable depth and deviation)

- Volume Profile for the last completed swing

- Point of Control (POC) - highest volume level

- Value Area (VAH + VAL) - configurable percentage

- High Volume Nodes (HVN) - volume above average threshold

- Fibonacci Retracement (0, 23.6, 38.2, 50, 61.8, 78.6, 100)

- RSI Overlay near current price

- Histogram positioning: Left, Right, or Near Bars

- Configurable rows (10 to 200)

- Customizable colors and opacity

- Extend lines to the right

- Show/hide price labels

- No repainting


--------------------------------------------------


HOW IT WORKS


1. The indicator detects swings using configurable depth and deviation

2. The last completed swing is identified

3. Volume profile is calculated from the swing range

4. POC, VAH, VAL, HVN are displayed

5. Fibonacci retracement is overlaid on the swing

6. Current RSI is displayed near price


All automatic. No manual input required.


--------------------------------------------------


VISUAL ELEMENTS


- Red down triangles = Swing highs

- Green up triangles = Swing lows

- Magenta dotted line = Swing connection

- Yellow horizontal line = Point of Control (POC)

- Blue dashed lines = Value Area High (VAH) and Value Area Low (VAL)

- Orange bars = High Volume Nodes (HVN)

- Gray bars = Low volume nodes

- Gold horizontal lines = Fibonacci levels

- White labels = Fibonacci percentages

- RSI value = Current RSI near price


--------------------------------------------------


PARAMETER OVERVIEW


PROFILE SETTINGS:

- Number of Rows: How many price rows (10-200)

- Value Area Percentage: % of volume in value area (1-100)


VISUAL SETTINGS:

- Histogram Position: Right, Left, Near Bars, or Near Bars Left

- Histogram Width %: Width of histogram bars

- Bar Width Scaling: Scaling factor for bar widths

- Min Bar Width %: Minimum bar width

- Bar Opacity: Transparency of bars (10-100)


SWING DETECTION:

- Swing Depth: How many bars to check for local extrema

- Deviation Mode: Fixed Pips or ATR-Based

- Fixed Deviation: Minimum pip distance between swings

- ATR Deviation Multiplier: Multiplier for ATR-based deviation

- ATR Period: Period for ATR calculation

- Backstep: Minimum bars between swings


VISUAL - SWINGS:

- Show Swing Lines: Toggle magenta swing line

- Swing Line Color

- Show Swing Labels: Toggle price labels

- High/Low Swing Colors


VISUAL - FIBONACCI:

- Show Fib Retracement: Toggle Fibonacci overlay

- Show Fib Lines: Toggle horizontal lines

- Show Fib Labels: Toggle percentage labels

- Fib Line Color / Fib Text Color


VISUAL - RSI:

- Show RSI Value: Toggle RSI overlay

- RSI Period: Period for RSI calculation

- RSI Label Color


COLORS:

- POC Color / Value Area Color / High Volume Node Color / Low Volume Color


--------------------------------------------------


USE CASES


- Identify swings and volume distribution in one view

- Find Point of Control (POC) for entries and exits

- Use Value Area (VAH/VAL) for profit targets

- Spot High Volume Nodes (HVN) for key levels

- Apply Fibonacci retracement to the swing

- Confirm trades with RSI confluence

- Understand volume distribution at a glance


--------------------------------------------------


UPGRADE TO STRUCTURAL HEAT ZONES


This indicator shows you swings and volume distribution.


Structural Heat Zones takes it further β€” it maps participation intensity, acceptance vs rejection, and market engagement across multiple zones.


Search for Structural Heat Zones in the cTrader Store.


--------------------------------------------------


UPGRADE TO INVICTUS EA


Invictus EA uses structural technology to execute automated trades.


Search for Invictus in the cTrader Store.


--------------------------------------------------


TECHNICAL NOTES


- Overlay indicator

- Works on any timeframe and symbol

- No repainting (historical calculation)

- Optimized for performance


--------------------------------------------------


SUPPORT


Lifetime updates included.


FOR MORE INFORMATION - Click Developer's Profile below.

Summary

Indicator profile
Indicator category
Volatility
Output type
Visualisation
Data requirements
Bars only
Tick data
Supported signals
Cross
Divergence
Breakout
Reversal
Trend strength
Volatility
Level touch
Level break
Session opening range

Customer reviews

0.0
Reviews: 0
Customer reviews
No reviews for this product yet. Already tried it? Be the first to tell others!

Discussion

FAQ

Fibonacci
Key Levels
RSI
Volume
Support & Resistance
Products available through cTrader Store, including trading bots, indicators and plugins, are provided by third-party developers and made available for informational and technical access purposes only. cTrader Store is not a broker and does not provide investment advice, personal recommendations or any guarantee of future performance.

More from this author

Indicator
ATR
RSI
+5
Free swing detector with Fibonacci retracement and RSI overlay. Auto-deviation adapts to any timeframe
cBot
ATR
Wedge
+5
15 YEARS RESULTS :Win rate:93% | ROI+19000% | Trades:87,000 | Profit Factor 1.2 | Currency Pairs:22 | $10k to 500k$ |
1.2
Profit factor
Indicator
ATR
BOS
+5
Heat intensity mapping of structural participation. See where price fights, where it accepts, and where it rejects .
Indicator
Volume
Imbalance
+1
Volume profile indicator that auto-detects the latest trendline. Shows POC, Value Area (VAH/VAL), and High Volume Nodes

You may also like

Indicator
ATR
SMC
+21
MA Quant Adaptive Price Zone Oscillator identifie dynamiquement les zones de prix optimales pour les entrΓ©es et sorties.
Indicator
Indices
Multi-Timeframe ADX Trend Dots & Arrows
Indicator
BOS
CHOCH
+1
Maps unmitigated SMC swing points. Draws infinite structure lines until price touches them, labeling BOS & CHoCH breaks.
Indicator
Key Levels
Liquidity Grab
+2
A practical XAUUSD workspace for mapped levels, session context, liquidity events, alerts and risk planning.
Indicator
ADX
ATR
+5
10 Factors. One Signal. Zero Guesswork.
Indicator
Prop
Forex
+13
Volume Meter
Indicator
XAUUSD
Professional Volume Profile Indicator - Shows volume distribution, POC, Value Areas & Buy/Sell pressure.
Indicator
ATR
Prop
Outside Candle Detector: Highlights major candles/zones with ATR filter & pattern labels. By Avydel Talbo, prop trader.
Indicator
AI
ATR
+27
Smart Money Gaps: MTF FVG auto-detection, extension, and mitigation marker. Trade institutional imbalances.
Indicator
Forex
cTrader ZigZag Alerts: Precision Swing Detection, Alerts, and Fibonacci.
Indicator
Flag
VWAP
+5
Session VWAP with statistical deviation bands, gradient cloud, and live rejection alerts β€” see exactly how stretched pri
Indicator
RSI
BTCUSD
+5
Traders Dynamic Index (TDI) β€” Divergence Edition
Indicator
Liquidity Sweep
A complete system for NASDAQ The tool that separates traders who "guess" from traders who operate like a professional.
Indicator
BOS
CHOCH
+5
A professional-grade cTrader indicator for traders following the Inner Circle Trader (ICT) methodology. It replaces 6–8
Indicator
ATR
SMC
+2
HTF POWER 3 ICT Power of 3 Β· M1 Precision Β· H4 Intelligence Auto-detect Accumulation β†’ Manipulation β†’ Distribution
Indicator
AI
SMC
+5
Complete ICT Killzones: 5 sessions, easy colors, transparency controls & session info. Professional timing for cTrader.
Indicator
Breakout
Institutional Flow Radar scans the chart for abnormal volume events and classifies them into two groups: Capital &Public
Indicator
Forex
Crypto
Bar Close Alert Manager provides real-time alerts for bar closures with customizable notifications and automation.

Price

Since 14/01/2025
1
Sales
123
Free installs



























