"MultiTimeframeMA_V1.14" logo
MultiTimeframeMA_V1.14
"MultiTimeframeMA_V1.14" uploaded image
Since 25/06/2025
6
Sales
About trial version
Trail version limites to 2 moving averages, 2 direction blocks and 1 start time line only. Full version includes morg feartures.

Features:

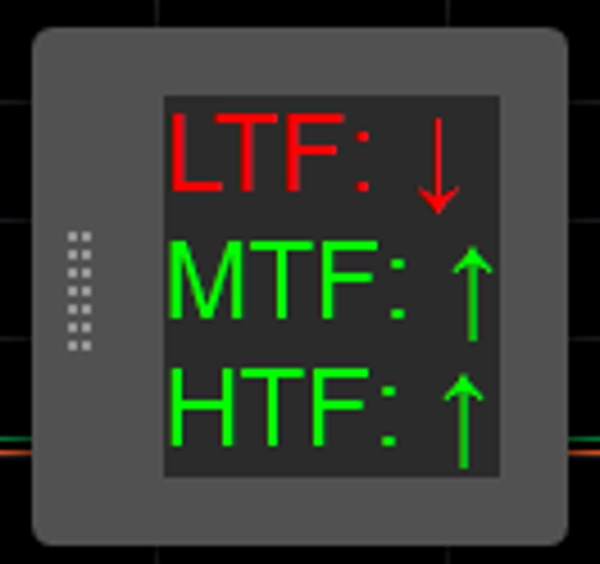
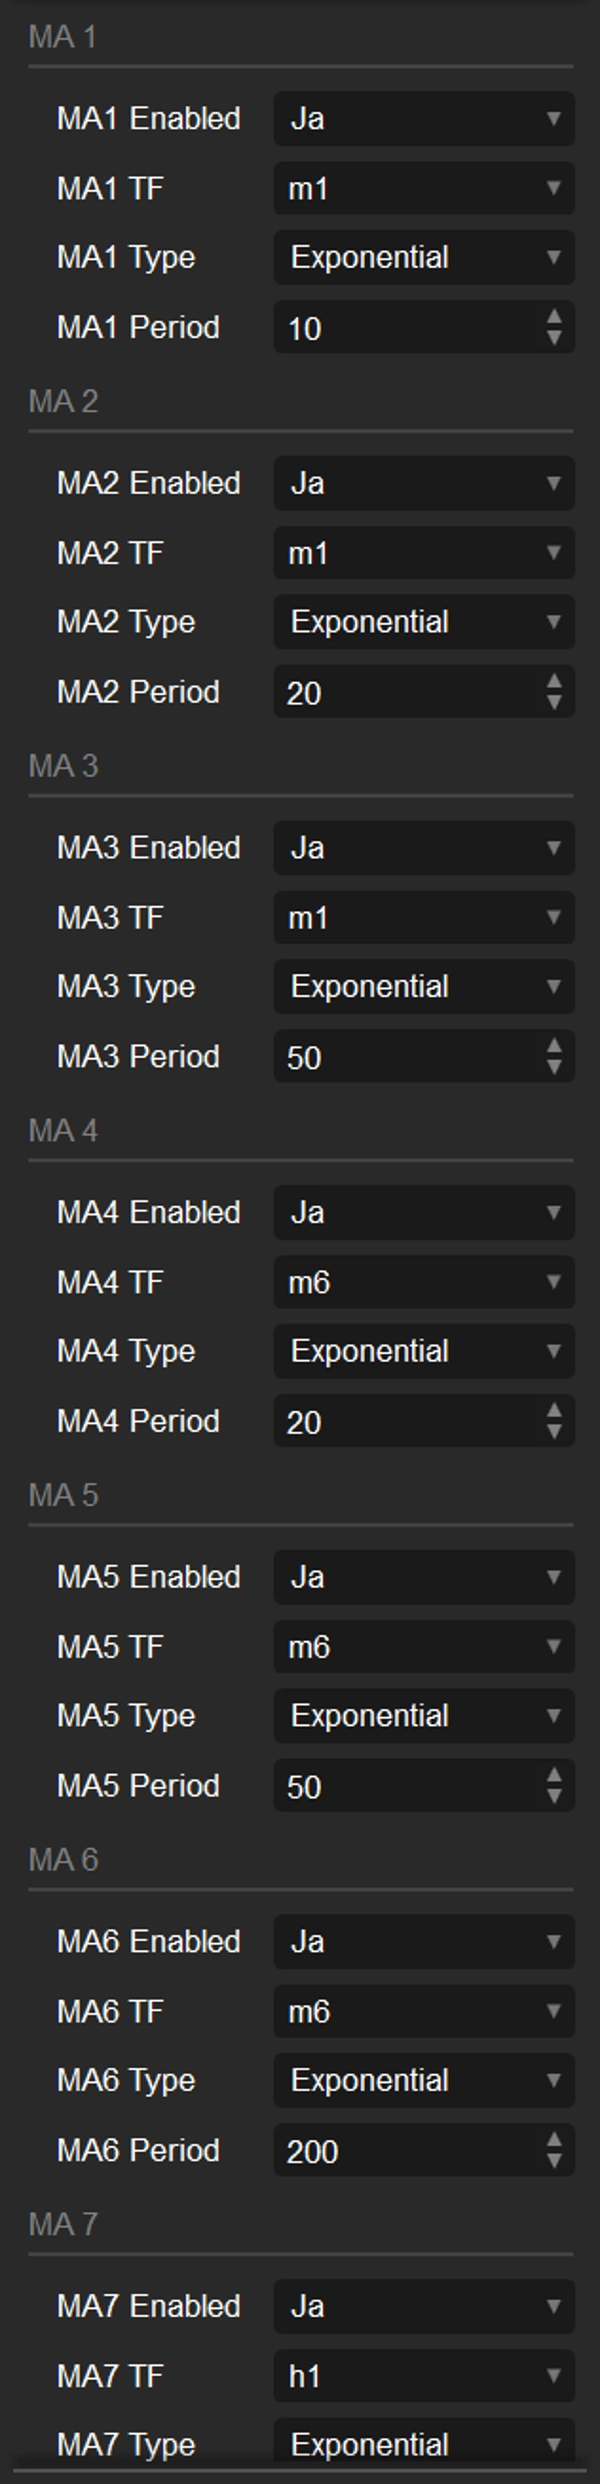
- Up to 9 Moving Averages with individual TimeFrame, Type, and Period

- Supported MA Types: SMA, EMA, WMA, LWMA, HMA

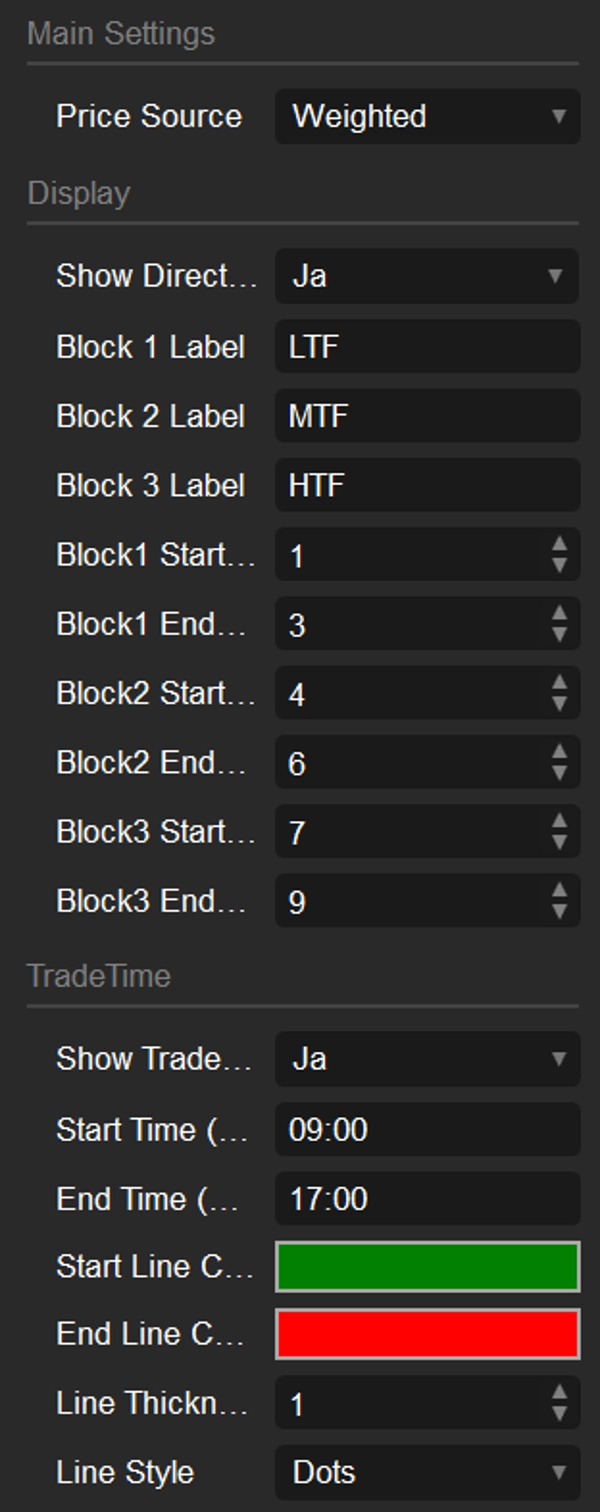
- Supported Price Sources: Close, Open, High, Low, HL2, HLC3, OHLC4, Median, Typical, Weighted

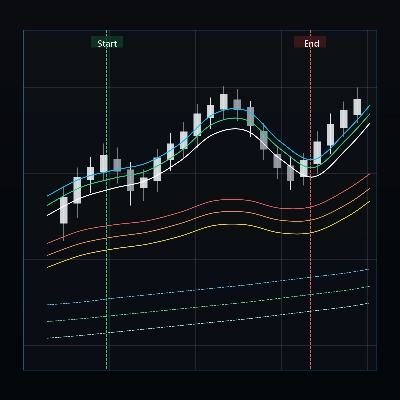
- Displayed directly on chart (Overlay)

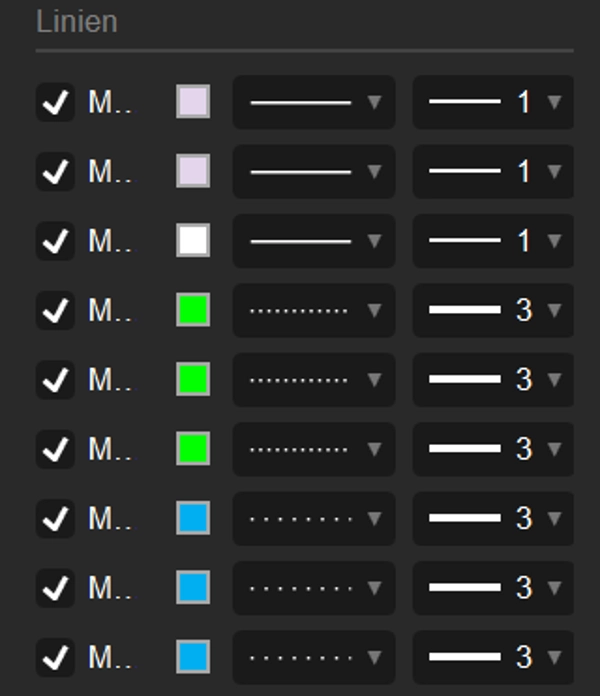
- MA colors/styles/thickness adjustable via Lines tab


Additional Feature: TradeTime Session Lines

- Two vertical lines for start and end time (HH:mm)

- Color, line style, and thickness fully customizable

- Can be enabled/disabled via parameter


Version: V1.14 (Stable)

Notes:

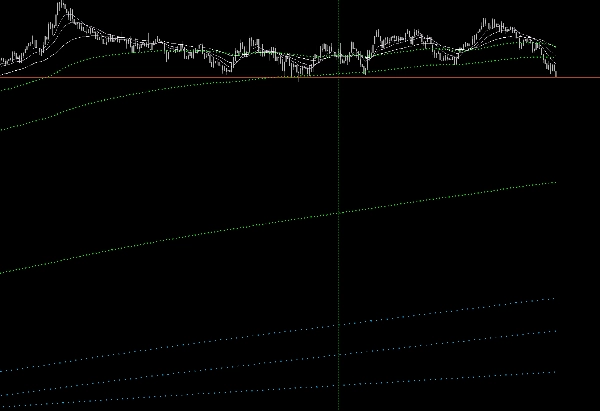
- HTF-MAs are displayed stepwise by default (real values)

-> No interpolation applied to preserve accuracy

About trial version
Trail version limites to 2 moving averages, 2 direction blocks and 1 start time line only. Full version includes morg feartures.
Indicator profile
0.0
Reviews: 0
Customer reviews
No reviews for this product yet. Already tried it? Be the first to tell others!
BTCUSD
Prop
Forex
Signal
Indices
Crypto
Stocks
XAUUSD
NAS100
Products available through cTrader Store, including trading bots, indicators and plugins, are provided by third-party developers and made available for informational and technical access purposes only. cTrader Store is not a broker and does not provide investment advice, personal recommendations or any guarantee of future performance.

More from this author

MultiTimeframe MA

You may also like

Delta Peak Bubbles is a tick‑chart overlay for cTrader that highlights the strongest momentum spikes.
Spot Strong Trends Early & Filter Market Noise
A precision tool for measuring how efficiently price moves from point A to B.
🔮 Projects statistically probable future price paths using MC simulation and evaluates directional bias through a.....
MagicLiquidity,indicator.Block Order, Liquids Stops, Signal Sentiment
Advanced price action tool that combines multiple technical analysis concepts
Combines multiple Currency Pairs / Symbols into a single Weighted Average Strength of that currency.
Refined cleaner version of Key Levels indicator with broker UTC offset, styles & label alignment.
RSI Trend Trigger 📈: Uses dual-layer RSI to spot trends & generate clear buy/sell signals.
Clean 3D, Sleek Candles for Trend Patterns.
Institutional Supply & Demand Mapping Across Five Timeframes — Automatically.
Precision ICT indicator detecting NWOG, NDOG & EHPDA for high-probability institutional trading setups.
✅ Unique Design. ✅ Works on All Time frames
The Trend Angle Indicator provides a clear and intuitive way to visualize market trends.
Yen Index
The Red & Green Zone Reversal Indicator detects overbought and oversold market conditions using Bollinger Bands and RSI.
PDHL - Previous Day High&Low
Detects Head & Shoulders patterns, plots signals, and alerts for trading opportunities.
Since 25/06/2025
6
Sales