
VA Footprint
Индикатор
2 покупки
Версия 2.0, May 2026
Windows, Mac
4.5
Отзывы: 4
Описание
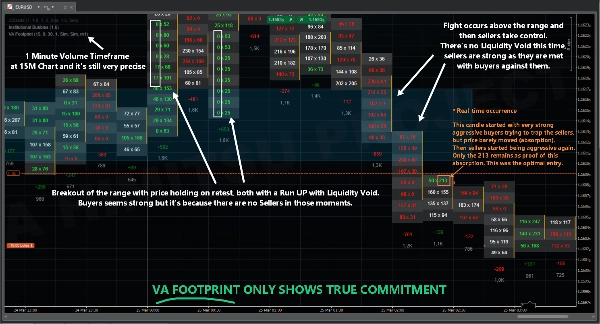
VA Footprint группирует агрессию по кластерам тиков, устраняя необходимость перекрестных ссылок между уровнями. Эта структура также обеспечивает устойчивость к HFT-спуфингу (например, wash trading или агрессивные ордера, смешанные с шумом, предназначенные для маскировки намерений на уровне bid x ask). Поскольку она измеряет обязательства по кластерам из 10 тиков и более, институциональной активности сложно и дорого скрывать свои следы.
Настраиваемые параметры (соответствующие настройки)
- Длительность бокса (минуты) --> Настройте в соответствии с таймфреймом вашего графика
- Размер уровня (%)
- Темный режим (true/false)
- Показать зону стоимости (true/false)
- Таймфрейм объема (10 тиков, 50 тиков)
Важные замечания
- РЕПЛЕЙ РЫНКА с точностью до тика работает, вы можете использовать его для тестирования вашей стратегии и проверки индикатора на более длительных периодах.
- Увеличение уровня тика добавляет точности, слишком сильное уменьшение снизит точность, рекомендуется не менее 0.10.
Сводка
ИИ-сводка
VA Footprint is an order flow indicator that replaces traditional charts with a detailed footprint view, enabling precise market reading. It groups aggressive trading activity by clusters of ticks (typically 10 or more), reducing the need to cross-reference price levels and providing resilience against high-frequency trading spoofing tactics such as wash trading or disguised aggressive orders. This clustering approach makes it difficult for institutional activity to conceal their market footprints.
Key adjustable parameters include box duration (to align with chart timeframe), level size percentage, dark mode toggle, value area display, and volume timeframe selection (e.g., 10-tick or 50-tick clusters). The indicator supports market replay with tick precision, allowing users to backtest strategies over extended periods.
VA Footprint is applicable across multiple markets including Forex, indices, and stocks, and supports trading strategies such as scalping and smart money concepts. It provides visualizations, signals for divergences, breakouts, reversals, trend strength, volatility regimes, and level breaks, relying on tick data, bars, and volume inputs. This tool is designed to enhance market structure analysis and order flow understanding for traders.
Профиль индикатора
Категория индикатора
Поток ордеров / DOM
Тип вывода
Визуализация
Сигналы
Фильтр
Требования к данным
Тиковые данные
Только бары
Объем
Поддерживаемые сигналы
Расхождение
Прорыв
Разворот
Сила тренда
Волатильность
Прорыв уровня
Отзывы покупателей
4.5
Отзывы: 4
5 | 50 % | |
4 | 50 % | |
3 | 0 % | |
2 | 0 % | |
1 | 0 % |
Отзывы покупателей
April 10, 2026
A decent setup here should survive 1 percent risk without looking messy. The first month should show both ROI and DD. The next review on it on 30 trades.
April 4, 2026
For risk management, this feels more useful as a filter than a full system. The journal should cover 76 setups and the trade context.
April 4, 2026
The stats tell the story. Tracking 1 percent risk first, compare the result with BE after 1R, and only scale if 1.5R partials still looks controlled.
March 31, 2026
Feels right for a user who wants less noise in the process. The best use is sizing and stop planning, then leaving the final filter manual. The problem appears when the tool makes weak ideas look acceptable.5R partials.
Обсуждение
Частые вопросы
Prop
Forex
Scalping
Indices
SMC
Stocks
Market Structure
Продукты, доступные в cTrader Store, включая торговых ботов, индикаторы и плагины, предоставляются сторонними разработчиками и доступны исключительно в информационных и технических целях. cTrader Store не является брокером и не предоставляет инвестиционные консультации, персональные рекомендации или какие-либо гарантии будущей доходности.
Больше от этого автора


![Логотип продукта "[Stellar Strategies] MARSI Signal Plotter"](https://cdn.ctrader.com/image/webp/7b2b8da6-8f8e-4646-8d4a-4710c516c01e_25567)


Цена
С 24/03/2026
10
Продажи
62
Бесплатные установки