

Institutional Bubbles
インジケーター
7 購入済
バージョン 1.0、Apr 2026
Windows、Mac
4.5
レビュー: 2
登録日 24/03/2026
13
販売
116
無料インストール
説明
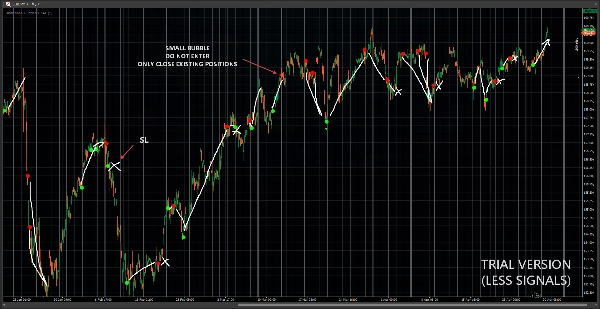
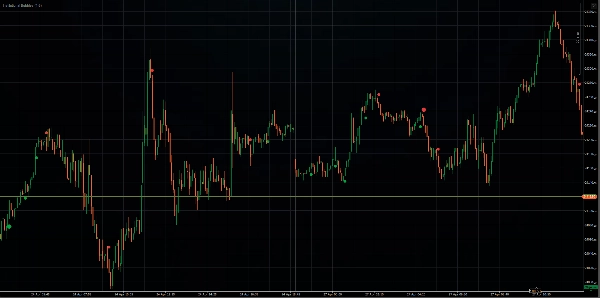
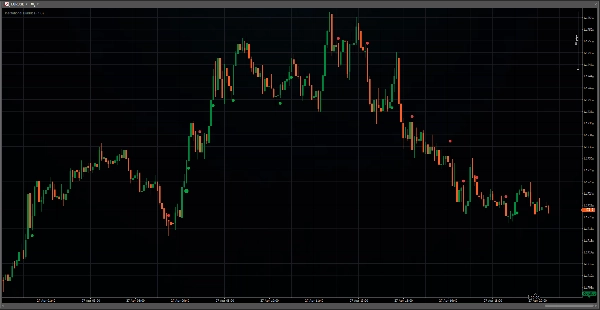
Institutional Bubblesは機関投資家の参加を検出することに焦点を当てています。
__ 機関の活動は流動性の状況や市場の文脈によって変動します。これに対応するために、この指標はラムダベースの正規化とローリングVWAPを組み合わせた独自のアルゴリズムを適用し、明らかな不均衡パターンを分離します。目的は明らかな疑わしいシグナルを強調して使用することではなく、人工的に「正常」でバランスの取れた活動を強調して使用することです。 __
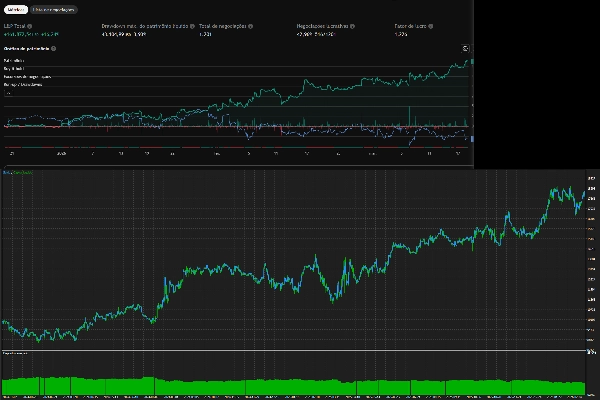
これは完全に定量化されたシステムです。他のプラットフォームでバックテストを行い、大きなサイズのバブルを盲目的に追うことで、一貫した優位性が得られることが1000回以上の取引で検証されました(バックテストはシグナルの方向に従い、反対側のシグナルが現れた場合にポジションをクローズし、フィルターや他の指標は使用していません)。すべてのシンボルで一貫した優位性があるため、この指標は戦略を別のレベルに引き上げ、エントリー時の自信を高めるのに最適です。
* デフォルト設定(感度=1.6以下)はすべてのシンボルに最適です。
* すべてのシンボルとタイムフレームがサポートされていますが、最も正確な読み取りのためにはM1またはM5の使用を推奨します。
* 自動取引アルゴリズムは販売していません。
概要
AI summary
Institutional Bubbles is a trading indicator designed to detect and quantify institutional participation in the market by analyzing volume and price action patterns. It uses a proprietary algorithm that combines lambda-based normalization with a rolling Volume Weighted Average Price (VWAP) to isolate subtle, balanced trading activity rather than obvious imbalances. This approach aims to reveal hidden institutional trading signals that are typically "normal" in appearance but carry predictive value.
The indicator supports all symbols and timeframes, with a recommendation to use 1-minute or 5-minute charts for the most precise readings. Its default sensitivity setting (1.6 or lower) is optimized for broad applicability across markets. Institutional Bubbles provides fully quantified signals that have been backtested over 1000+ trades across multiple platforms, demonstrating a consistent edge when following the indicator’s directional signals without additional filters.
Key features include visualization of institutional activity, signal generation for breakouts, reversals, trend strength, volatility regimes, and support/resistance levels. It requires only bar data and is categorized under support and resistance indicators. This tool is intended to enhance trading strategies by offering insights into hidden market dynamics driven by large participants.
The indicator supports all symbols and timeframes, with a recommendation to use 1-minute or 5-minute charts for the most precise readings. Its default sensitivity setting (1.6 or lower) is optimized for broad applicability across markets. Institutional Bubbles provides fully quantified signals that have been backtested over 1000+ trades across multiple platforms, demonstrating a consistent edge when following the indicator’s directional signals without additional filters.
Key features include visualization of institutional activity, signal generation for breakouts, reversals, trend strength, volatility regimes, and support/resistance levels. It requires only bar data and is categorized under support and resistance indicators. This tool is intended to enhance trading strategies by offering insights into hidden market dynamics driven by large participants.
インジケーターのプロフィール
インジケーターのカテゴリー
サポート&レジスタンス
出力の種類
ビジュアル表示
シグナル
フィルター
データ要件
バーのみ
サポート対象のシグナル
ブレイクアウト
反転
トレンドの強さ
ボラティリティ
ラインブレイク
ラインタッチ
カスタマーレビュー
4.5
レビュー: 2
5 | 50 % | |
4 | 50 % | |
3 | 0 % | |
2 | 0 % | |
1 | 0 % |
ディスカッション
よくあるご質問
Volume
Market Structure
Supply & Demand
VWAP
Support & Resistance
cTrader Storeで入手可能な取引ボット、インジケーター、プラグインなどの商品は、第三者の開発者が提供するものであり、情報と技術の取得のみを目的としてご利用いただけます。cTrader Storeはブローカーではなく、投資助言や個人的な推奨を行うことも、将来のパフォーマンスを保証することもありません。






















価格
登録日 24/03/2026
13
販売
116
無料インストール