present
سجل واحصل على خصم 50 دولارًا على مشترياتك الأولى
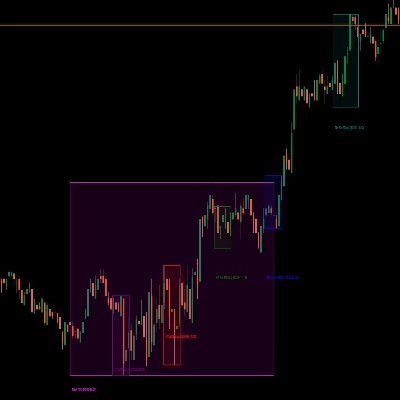
Trading product for Smart Price Action Concepts مؤشر Fair Value Gap Order Block, image 1
Smart Price Action Concepts
مؤشر
الإصدار 1.1، Oct 2026
Windows, Mac
Trading product for Smart Price Action Concepts مؤشر Fair Value Gap Order Block, image 2
Trading product for Smart Price Action Concepts مؤشر Fair Value Gap Order Block, image 3
Trading product for Smart Price Action Concepts مؤشر Fair Value Gap Order Block, image 4
منذ 16/10/2026

الوصف

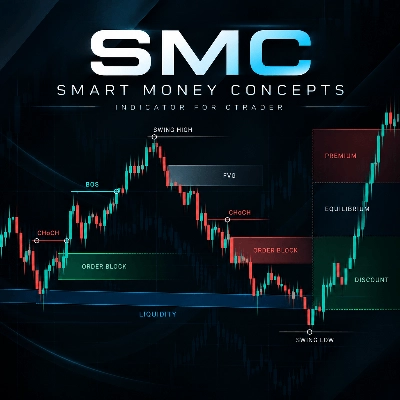
Smart Price Action Concepts brings market structure and price context together on your cTrader chart. Use one interactive dashboard to control internal and swing structure, order blocks, liquidity levels, fair value gaps and a broader market map.


STARTING CHARTS AND USE

Designed for discretionary traders who use market structure and price action to plan chart analysis. EURUSD on H1 is a practical starting point used in the native checks. The illustrated examples also show M15, H4 and H12. Review your chosen instrument, period and broker data on a demo chart.


READ MARKET STRUCTURE

Follow bullish and bearish breaks of structure (BOS), changes of character (CHoCH), swing labels and equal highs/lows. Internal and swing structure can be displayed independently, so you can choose the detail appropriate for your analysis.


SEE THE AREAS THAT MATTER

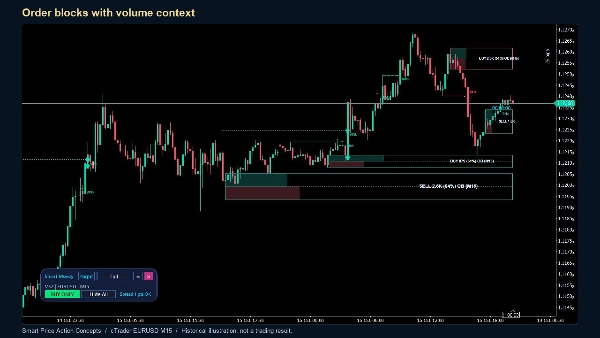
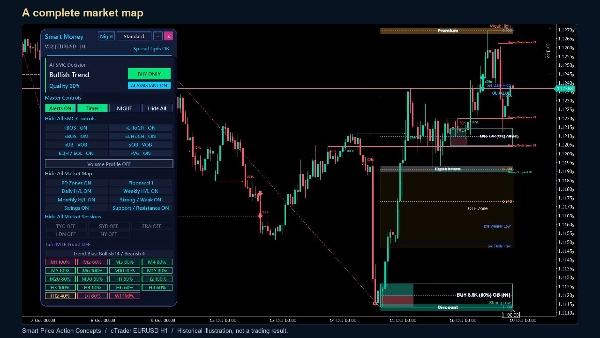
Display order blocks with several presentation modes, including volume information, together with fair value gaps. Premium, equilibrium and discount levels, Fibonacci/OTE areas, previous daily/weekly/monthly highs and lows, strong/weak levels and support/resistance provide additional context. Translucent fills keep the candles visible.


COMPARE TIMEFRAMES

The dashboard combines enabled moving-average, MACD, ADX, Ichimoku and SAR votes and shows multi-timeframe agreement. Its quality percentage measures agreement among those analytical inputs. It is not a probability of profit or a historical win rate. Select a supported timeframe from the panel to change the chart.


CONTROL YOUR WORKSPACE

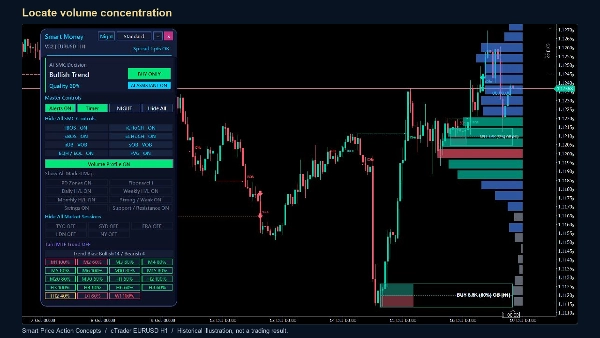
Move or collapse the panel, switch between compact, standard and full layouts, and choose panel and chart themes independently. Show or hide entire groups or individual features. The optional volume profile displays the distribution of chart volume, a point of control and a value area. Session controls display configured market-session ranges.


ALERTS AND SETUP

Attach the indicator to a supported time-based cTrader chart and allow its history to load. Choose the features you want to see and review the alert master switch and individual event settings. Desktop popups, sound and email are configurable; email requires the platform's email setup and valid sender/recipient addresses. Session times use the configured hours and offset. Volume calculations use the volume supplied by the cTrader chart, which is tick volume for this implementation.


IMPORTANT

This is an analytical indicator. It does not place or manage trades. Structure and zones develop as new bars arrive; pivot confirmation can appear on earlier candles, and invalidated zones can be removed. Historical screenshots illustrate the display, not an audited trading record or a promise of results. The panel describes its current calculation context, even when you scroll back through history.


Trading involves risk. Past performance does not guarantee future results.


الملخص

ملف تعريف المؤشر
فئة المؤشر
هيكل السوق (SMC)
نوع المخرجات
التصور
الإشارات
متطلبات البيانات
أعمدة السعر فقط
الحجم
الإشارات المدعومة
كسر المستوى

مناقشة

تقييمات العملاء

0.0
التقييمات: 0
تقييمات العملاء
لا توجد تقييمات لهذا المنتج حتى الآن. هل جرَّبته بالفعل؟ كن أول من يخبر الآخرين!

الأسئلة الشائعة

Fair Value Gap
Order Block
Volume
Market Structure
Support & Resistance
يتم توفير المنتجات المتاحة من خلال cTrader Store، بما في ذلك روبوتات التداول والمؤشرات والإضافات، من قبل مطوري الطرف الثالث وإتاحتها لأغراض الوصول المعلوماتي والفني فقط. cTrader Store ليس وسيطًا ولا يقدم نصائح استثمارية أو توصيات شخصية أو أي ضمان للأداء المستقبلي.

المزيد من هذا المؤلف
مؤشر
RSI
VWAP
+5
Trend direction, chart signals, reversal zones and volume tools in one configurable indicator.

قد يعجبك أيضًا

مؤشر
Forex
EURUSD
+5
The Smart Money Concepts indicator is an all-in-one overlay tool that automatically detects OB, FVG ecc..
مؤشر
SMC
Forex
+5
Detects Break of Structure (BOS) and Change of Character (CHOCH)
مؤشر
Doji
Wedge
+5
Angora Pattern Recognition is a cTrader indicator that finds, draws and tracks classic chart patterns automatically.
مؤشر
ATR
RSI
+4
RSI bands drawn on price, confluence-scored BUY/SELL signals, an ATR stop with three targets
مؤشر
ATR
BTCUSD
+5
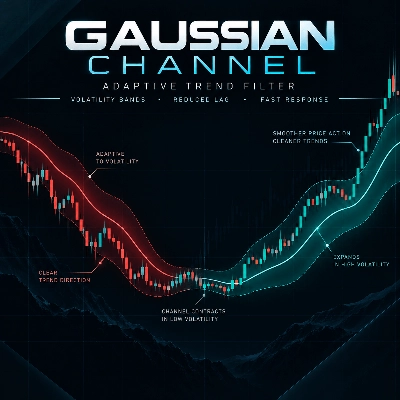
Multi-pole Gaussian filter channel with dynamic color, Reduced Lag & Fast Response modes. Port of DonovanWall's original
مؤشر
SMC
Prop
+14
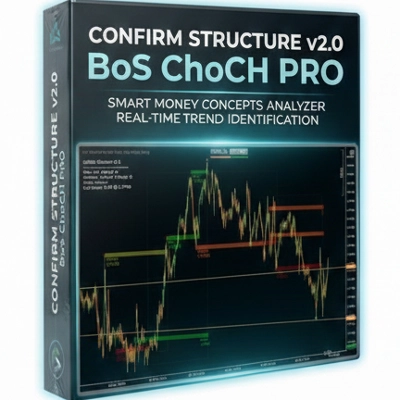
BoS ChoCH Pro,Strict Mode,False Breakout Filter,Average hit rate: 72-78%
مؤشر
SMC
Forex
+15
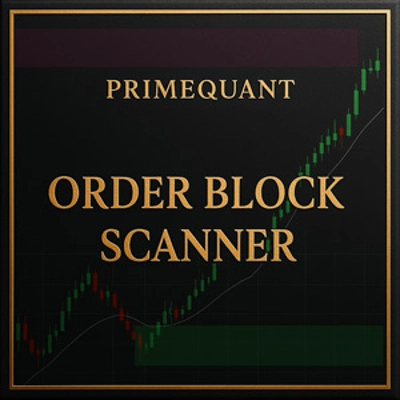
Smart institutional order block & FVG scanner with alerts, zone merging, and HTF confluence.
شعار "ICT Killzones & Macros"
الأعلى تقييمًا
4.7
(4)
$20
/
$30
مؤشر
SMC
Prop
+8
KILLZONES AND MACRO SESSIONS
مؤشر
SMC
Prop
+5
ADVANCED ICT + ADR + AWR SUITE PRO (The Ultimate All-in-One Toolkit for Price Action Traders)
مؤشر
Volume
Key Levels
View tick activity across a selected chart range with Point of Control, Value Area High and Value Area Low.
مؤشر
RSI
RSI on the main chart with 45/55 momentum levels, overbought/oversold levels, averaged RSI, and multi-timeframe support.
مؤشر
Fair Value Gap
Liquidity Grab
+2
PRO Liquidity Sweep + FVG Combo detector with custom Gold/Blue signals & alerts
مؤشر
Prop
Forex
+11
🧭 See when your market tends to move—by Month, Day-of-Week, or Hour-of-Day🧭
مؤشر
ATR
Wedge
+2
Strong Supertrend Turn Market Movement into a Clear Map Market analysis
مؤشر
Prop
Forex
+4
Personal trade tracker for a single symbol. Clear net profit summary — FreshNet, ManageNet, DayNet, WTDNet, MTDNet.
مؤشر
RSI
VWAP
+3
Asia, London & NY sessions mapped in real time, boxes, VWAP, kill zones, range extensions, and a built-in RSI panel.
مؤشر
VWAP
Forex
+12
Unlock VWAP in cTrader! Choose anchor periods, price sources, and display deviation bands with real-time tick updates.
مؤشر
AI
RSI
+7
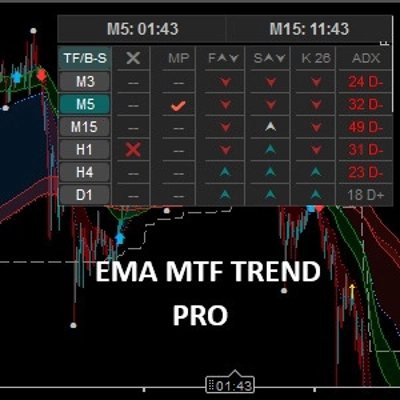
EMA MTF TREND PRO - Multi-timeframe trend analysis overlay indicator, 6 timeframes - in one table with ADX

السعر

منذ 16/10/2026