
Descrizione
📊 Trading Pro Market
https://chartshots.spotware.com/c/69f0ec41d4cfc
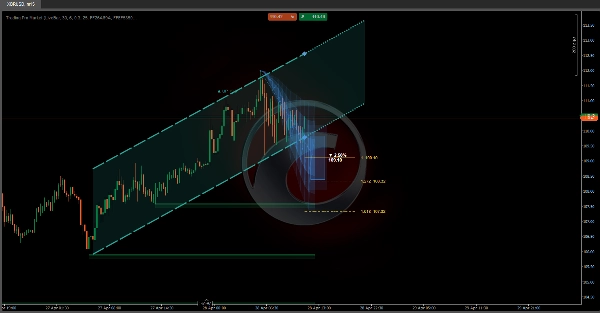
Canale di tendenza + previsione del prezzo + zone automatiche di supporto e resistenza — tutto in un unico indicatore sovrapposto
🔍 Cos'è?
https://chartshots.spotware.com/c/69f0ec1fa9930
Trading Pro Market è un indicatore avanzato di analisi tecnica che combina tre motori indipendenti in un unico strumento: un canale di tendenza con proiezione futura, un sistema di previsione del prezzo basato su modelli di movimento storici e un rilevatore automatico di zone di supporto e resistenza. Tutto viene visualizzato direttamente sul grafico dei prezzi — nessun pannello separato necessario.
📐 Modulo 1 →Canale ICP🔮 Modulo 2 → Previsione MFP 🧲 Modulo 3 → Zone S/R
https://chartshots.spotware.com/c/69f0ec8faa957
📐 Modulo 1 — Canale di tendenza (ICP)
⚙️ Come rileva la tendenza?
L'indicatore divide le barre visibili in blocchi temporali (predefinito: 30 barre per blocco, 6 blocchi totali). All'interno di ogni blocco calcola il punto medio geometrico tra il massimo più alto e il minimo più basso usando una scala logaritmica dei prezzi. Quindi collega questi punti medi tra i blocchi per determinare se il prezzo è in tendenza rialzista, ribassista o si muove lateralmente.
La pendenza di quella linea di collegamento viene convertita in un angolo espresso in gradi. Se l'angolo scende al di sotto della soglia configurata (predefinita 0,3°), il mercato viene classificato come laterale. Sopra quella soglia, l'indicatore assegna una direzione rialzista o ribassista.
💡 La volatilità viene misurata utilizzando lo stimatore Yang-Zhang — una formula statistica che usa i prezzi di apertura, chiusura, massimo e minimo per calcolare la vera volatilità di mercato. Questo numero normalizza gli angoli affinché il canale si comporti in modo coerente su qualsiasi asset o timeframe.
🎨 Cosa disegna sul grafico?
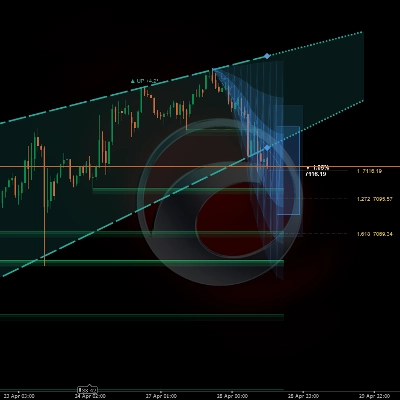
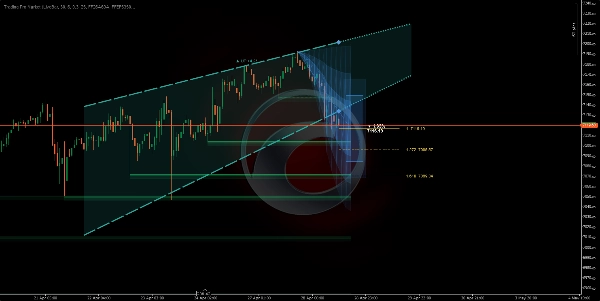
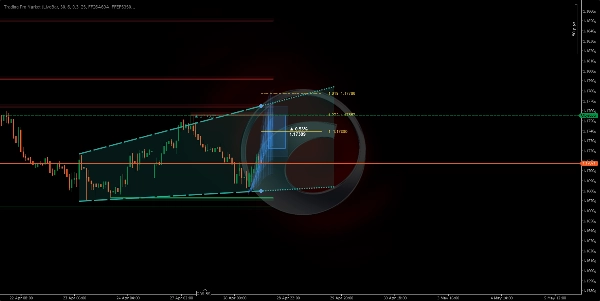
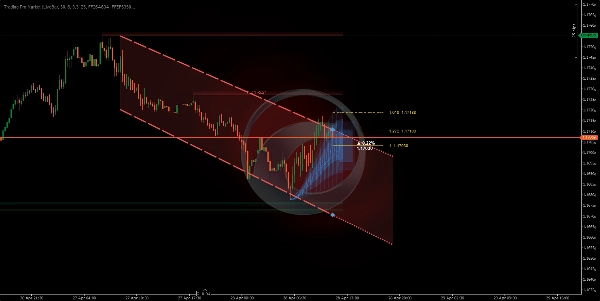
Traccia due linee che formano il canale (soffitto e pavimento), con una zona riempita sfumata tra di esse. A destra, il canale si estende come una proiezione tratteggiata seguendo la pendenza attuale. I colori cambiano automaticamente in base alla direzione:
🟢 Verde — tendenza rialzista🔴 Rosso — tendenza ribassista⬜ Grigio — mercato laterale
🔁 Macchina a stati — dove si trova il prezzo all'interno del canale?
L'indicatore traccia la posizione in tempo reale del prezzo di chiusura rispetto ai confini del canale e classifica la situazione in cinque stati distinti:
🟦 Interno→⚡ Rottura→📏 Distanziato→↩️ Retest→✅ Confermato
Ogni stato è descritto in testo semplice nel pannello informativo del grafico, insieme alla distanza percentuale dal soffitto o dal pavimento del canale in ogni momento.
🔮 Modulo 2 — Previsione del movimento (MFP)
⚙️ Come genera la previsione?
Il motore rileva pivot significativi del prezzo (massimi e minimi locali) guardando indietro un numero configurabile di barre. Ogni pivot confermato registra due dati: la percentuale di movimento del prezzo completata e il numero di barre impiegate. Vengono memorizzati fino a 20 movimenti storici, e il movimento successivo previsto viene calcolato usando uno di tre metodi:
⚖️ Ponderato — i movimenti recenti hanno più peso➕ Media semplice — tutti i movimenti pesati ugualmente📊 Mediana — gli outlier vengono filtrati
🎨 Cosa disegna sul grafico?
Tre elementi visivi opzionali sono proiettati nel futuro basandosi sull'origine del pivot attuale:
1
🔵 Zona di proiezione: tre strati di opacità decrescente che illustrano l'intervallo probabile del movimento. Un cono più ampio significa maggiore incertezza basata sulla varianza storica.
2
🎯 Box obiettivo: un rettangolo posizionato al prezzo di destinazione stimato, con la percentuale di movimento prevista e il livello di prezzo esatto etichettati nel testo.
3
📏 Livelli di Fibonacci: linee orizzontali proiettate dall'origine alla destinazione usando rapporti configurabili (predefiniti: 1.0, 1.272, e 1.618).
⚠️ La previsione non predice il futuro. È una media statistica di movimenti simili passati. Il suo valore risiede nell'impostare aspettative realistiche per ampiezza e durata — non come segnale autonomo di entrata o uscita.
🧲 Modulo 3 — Zone di supporto e resistenza
⚙️ Come rileva le zone?
Ogni volta che un pivot è confermato, l'indicatore disegna una zona orizzontale usando l'ATR (Average True Range) per determinare lo spessore della zona. Le zone di resistenza sono disegnate in rosso, le zone di supporto in verde — entrambe con due livelli di opacità per creare profondità visiva e chiarezza.
Le zone si comportano in modo dinamico: se il prezzo chiude dall'altra parte della zona, viene contrassegnata come "rotta" — passando a una linea tratteggiata con opacità ridotta. Le zone scompaiono automaticamente dopo il numero di barre configurato in "Durata della zona".
🚀 Come usarlo
1
Conferma la tendenza: controlla il colore e la direzione del canale. L'angolo in gradi indica quanto è forte la tendenza — un angolo più ripido significa più slancio.
2
Leggi lo stato del prezzo: il pannello informativo sul grafico descrive se il prezzo è all'interno, in rottura o in retest del confine del canale in tempo reale.
3
Valuta la proiezione: il cono e il box obiettivo forniscono un riferimento su dove e quanto lontano il prezzo potrebbe muoversi, basandosi sulla libreria di modelli storici accumulata durante la sessione.
4
Rispetta le zone: i box S/R non rotti indicano livelli di prezzo dove il mercato ha reagito in precedenza. Una zona non ancora perforata ha più importanza di una già attraversata.
🖥️ Compatibilità e requisiti
✅ cTrader✅ cAlgo API✅ Qualsiasi asset✅ Qualsiasi timeframe✅ Sovrapposizione prezzo
Non è necessario accesso a internet o permessi speciali. Tutti i calcoli vengono eseguiti localmente utilizzando i dati di prezzo già disponibili nella piattaforma.
⏱️ Per risultati ottimali, utilizzare su timeframe di 15 minuti o superiori. Su timeframe molto bassi (1–5 minuti) il rumore di mercato può produrre pivot con bassa affidabilità statistica, riducendo la qualità sia delle zone S/R che della previsione.
Riepilogo
1. Trend Channel (ICP): Divides visible bars into time blocks, calculates geometric midpoints on a logarithmic price scale, and connects these to identify trend direction (bullish, bearish, or ranging) with a slope angle. It visualizes the trend channel with color-coded lines and shaded zones, projecting the channel forward. The indicator tracks the price’s position relative to the channel, classifying it into five states (Inside, Breakout, Distanced, Retest, Confirmed) displayed on an info panel.
2. Movement Forecast (MFP): Detects significant price pivots and analyzes up to 20 historical moves to statistically estimate the next price movement using weighted, average, or median methods. It projects a probabilistic range (Projection Zone), a target price box with expected move percentage, and Fibonacci levels for reference.
3. Support & Resistance Zones: Automatically identifies horizontal support and resistance zones based on confirmed pivots and ATR for zone thickness. Zones are color-coded (green for support, red for resistance), dynamically update when broken, and expire after a configurable lifespan.
All calculations are performed locally without internet access or special permissions. The tool provides visual signals for trend strength, breakout, and key level interactions directly on the price chart.
Discussioni
Recensioni dei clienti
5 | 33 % | |
4 | 67 % | |
3 | 0 % | |
2 | 0 % | |
1 | 0 % |













![Logo di "[Stellar Strategies] Market Session Ultimate"](https://cdn.ctrader.com/image/webp/61ffd537-0125-4246-9e72-42eca1791d64_28232)











![Logo di "[Hamster-Coder] Pivot Points MTF"](https://cdn.ctrader.com/image/webp/4c143e5a-309c-40e3-a578-f04d1e133ffa_31159)
![Logo di "High-Low Divergence [Iridio Capital]"](https://cdn.ctrader.com/image/webp/10a9e91b-243a-43f6-bbfe-7376bad5a214_61554)


