
Volume Profile Triple Line - POC Median Mode
Indikator
4 käufe
Version 1.0, Feb 2025
Windows, Mac
4.0
Bewertungen: 2
Beschreibung
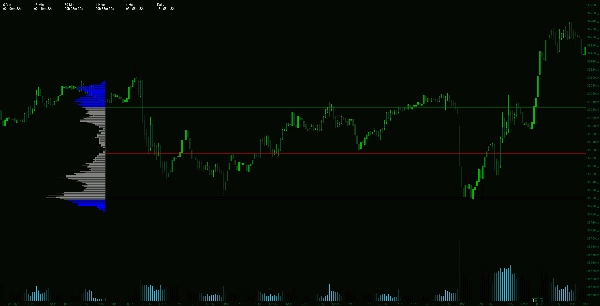
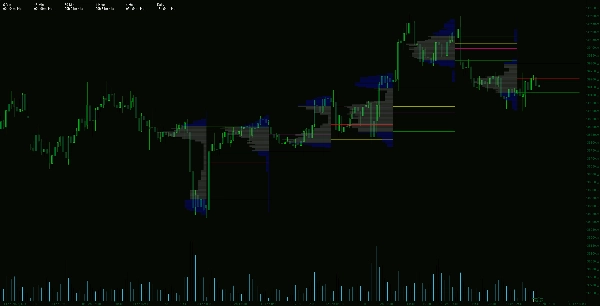
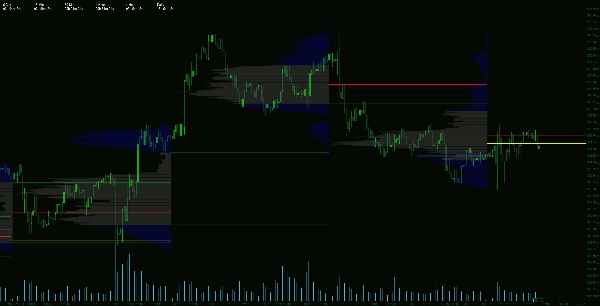
Der Advanced Volume Profile Indicator ist ein professionelles Trading-Tool, das entwickelt wurde, um durch Volumenanalyse tiefgehende Markteinblicke zu bieten. Er berechnet den Point of Control (POC), Median und Modus und bietet eine präzise Ansicht der Preisniveaus, an denen bedeutende Marktaktivitäten stattfinden.
Hauptmerkmale:
Zusammenfassung
KI-Zusammenfassung
The Advanced Volume Profile Indicator is a professional trading tool that analyzes market volume to identify key price levels. It calculates the Point of Control (POC), Median, and Mode, highlighting price points with the highest traded volume and providing statistical insights into price balance and trend strength. The indicator displays the previous day's volume distribution and volume curve, then projects key levels such as Value Area High (VAH), Value Area Low (VAL), POC, Median, and Mode onto the following day. This helps traders identify support and resistance zones, volume gaps, and areas of accumulation or distribution. By leveraging volume-based data, users can refine trade entries, exits, and stop-loss placements for improved market positioning. The indicator requires significant memory resources due to its detailed volume distribution calculations.
Indikatorprofil
Kundenbewertungen
4.0
Bewertungen: 2
5 | 0 % | |
4 | 100 % | |
3 | 0 % | |
2 | 0 % | |
1 | 0 % |
Kundenbewertungen
February 26, 2025
A few ugly trades are useful in the sample, and the log becomes easier to read.
February 20, 2025
It becomes more useful when fewer random clicks reach the trade log, and 20 reactions is a fair first sample.
Diskussion
Häufig gestellte Fragen (FAQ)
Über den cTrader Store verfügbare Produkte, einschließlich Handelsbots, Indikatoren und Plugins, werden von externen Entwicklern bereitgestellt und nur zu Informations- und technischen Zugriffszwecken verfügbar gemacht. cTrader Store ist kein Broker und erbringt keine Anlageberatung, persönlichen Empfehlungen oder eine Garantie für zukünftige Performance.


Preis
Seit 14/01/2025
55
Verkäufe
11.34K
Kostenlose Installationen