
HLC_Levels
อินดิเคเตอร์
4 การซื้อ
เวอร์ชัน 1.0, Feb 2026
Windows, Mac
4.3
รีวิว: 3
คำอธิบาย
คำอธิบาย:
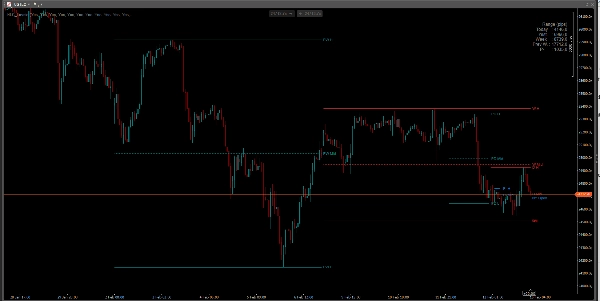
หยุดวาดเส้นด้วยตนเองทุกวัน Advanced HLC & Session Levels เป็นตัวบ่งชี้ที่ครอบคลุมออกแบบมาสำหรับเทรดเดอร์มืออาชีพที่พึ่งพาจุดอ้างอิงสถาบัน ไม่ว่าคุณจะเทรด Price Action, แนวคิด ICT หรือกลยุทธ์ Breakout เครื่องมือนี้จะช่วยให้กราฟของคุณสะอาดและระดับของคุณแม่นยำ
คุณสมบัติหลัก:
- ระดับรายวัน: แสดงระดับสูง ต่ำ และกลาง (50%) ของวันนี้และเมื่อวานโดยอัตโนมัติ
- ระดับรายสัปดาห์: แสดงระดับสูง ต่ำ และกลางของสัปดาห์ปัจจุบันและสัปดาห์ก่อนหน้า
- เปิดตลาดเที่ยงคืน NY: สวิตช์เฉพาะสำหรับระดับราคาสถาบันนิวยอร์ก 00:00 (เปิดวันจริง) ซึ่งสำคัญสำหรับทิศทางแนวโน้ม
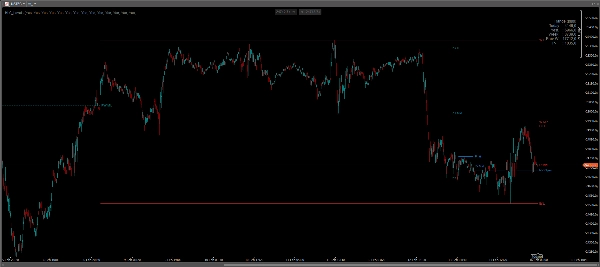
- ช่วงเวลาที่กำหนดเอง / เซสชัน: กำหนดช่วงเวลาของคุณเอง (เช่น เซสชันเอเชีย, เปิดลอนดอน หรือ Initial Balance) ตัวบ่งชี้จะวาดระดับสูง ต่ำ และกลางสำหรับช่วงเวลานั้น
- แดชบอร์ดความผันผวน: ตารางบนกราฟที่แสดงช่วงพิป (สูงลบต่ำ) สำหรับวัน, เมื่อวาน, สัปดาห์, สัปดาห์ก่อนหน้า และช่วงเวลาที่กำหนดเองของคุณ
- ความชาญฉลาดของโซนเวลา: ทำงานร่วมกับเวลาของโบรกเกอร์, UTC, NY หรือเวลาท้องถิ่นเพื่อให้ระดับสอดคล้องกับกลยุทธ์ของคุณ
ทำไมต้องใช้ตัวบ่งชี้นี้?
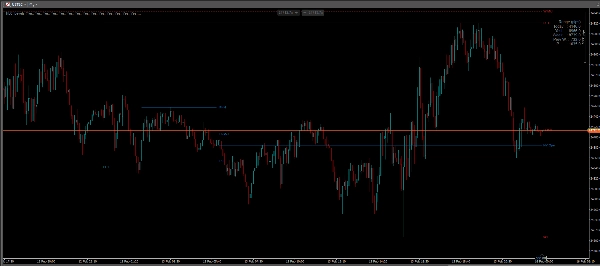
- จุดตอบสนอง: ระดับสูง/ต่ำเก่าและจุดกึ่งกลางมักทำหน้าที่เป็นแนวรับและแนวต้านที่แข็งแกร่ง
- จุดกึ่งกลาง (สมดุล): ระดับ 50% เป็นกุญแจสำคัญในการระบุราคาที่ "ลดราคา" กับ "พรีเมียม"
- ปรับแต่งได้เต็มที่: เปิด/ปิดเส้นใดก็ได้ เปลี่ยนสี, รูปแบบเส้น และตำแหน่งป้ายให้ตรงกับเทมเพลตของคุณ
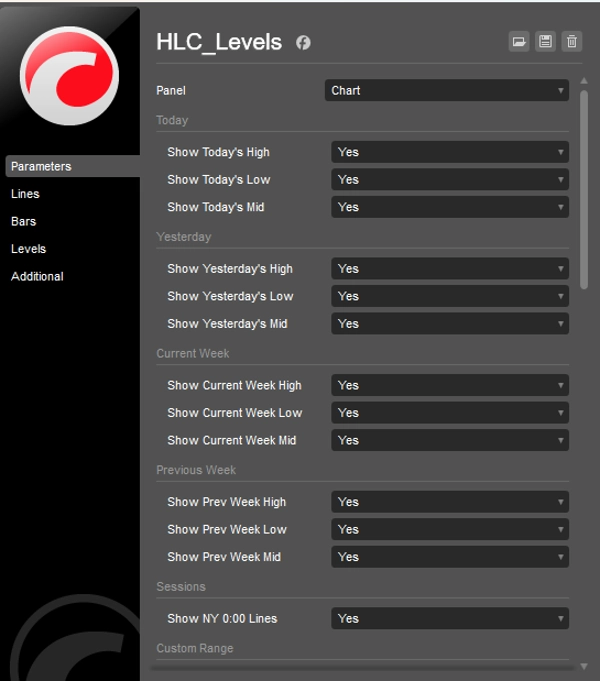
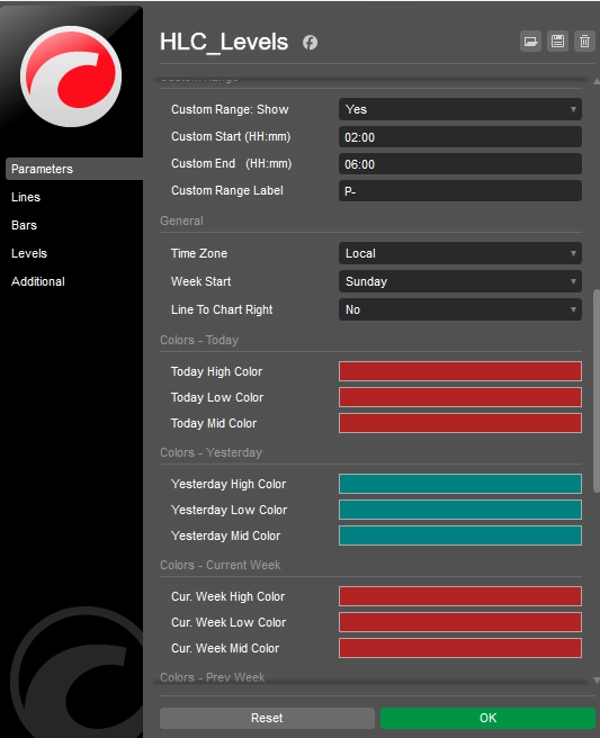
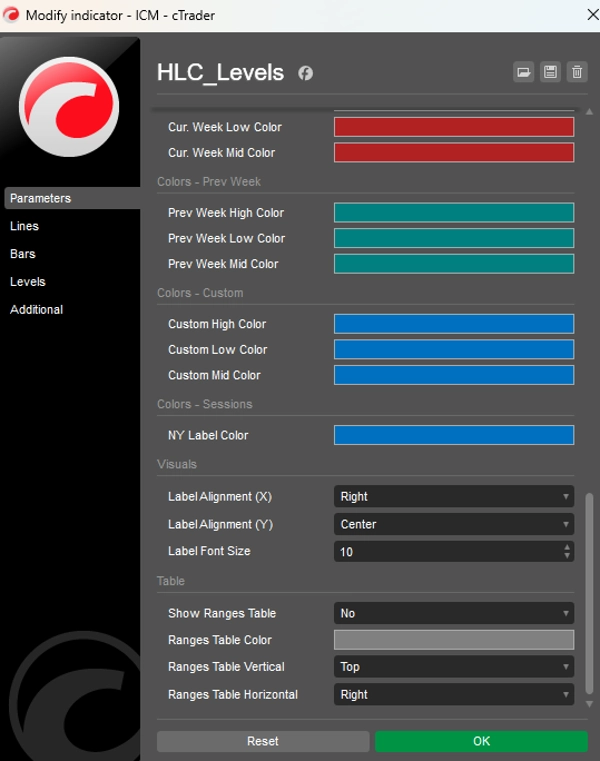
การตั้งค่า:
- เปิด/ปิดช่วงเวลาที่เฉพาะเจาะจง (วันนี้, เมื่อวาน, สัปดาห์, สัปดาห์ก่อนหน้า)
- เวลเริ่มต้น/สิ้นสุดที่กำหนดเองสำหรับช่วงเซสชันเฉพาะ
- ตัวเลือก "ขยายเส้น" เพื่อฉายระดับไปยังอนาคต
- สีที่กำหนดเองสำหรับแต่ละกลุ่มของเส้น
สรุป
โปรไฟล์อินดิเคเตอร์
รีวิวจากลูกค้า
4.3
รีวิว: 3
5 | 33 % | |
4 | 67 % | |
3 | 0 % | |
2 | 0 % | |
1 | 0 % |
รีวิวจากลูกค้า
May 16, 2026
Bit weird to see there is no Close level eventhough it's called HLC_levels.. There is a high and low and a mid, but no close. I kinda find it essential to have a close though. Other than that is safes me huge amount of time daily to not set all these levels manually. So besides the lack of the close level i still like this indicator. Would love to see a new version with the added close level as the name suggests
March 2, 2026
A 5 minute check should not become a 30 minute rabbit hole, and the entry needs one more reason to make sense.
February 21, 2026
most of the value comes from the decision gets a little more breathing room. The market context still matters.
การสนทนา
คำถามที่พบบ่อย
Prop
Forex
Scalping
Indices
SMC
AI
XAUUSD
NAS100
USDJPY
ผลิตภัณฑ์ที่มีให้บริการผ่าน cTrader Store รวมถึงบอทการเทรด อินดิเคเตอร์ และปลั๊กอิน มีให้บริการโดยนักพัฒนาบุคคลที่สามและมีไว้เพื่อวัตถุประสงค์ในการเข้าถึงข้อมูลและทางเทคนิคเท่านั้น cTrader Store ไม่ใช่โบรกเกอร์และไม่ได้ให้คำแนะนำการลงทุน คำแนะนำส่วนบุคคล หรือการรับประกันผลการดำเนินงานในอนาคต


!["[Stellar Strategies] MARSI Signal Plotter" โลโก้](https://cdn.ctrader.com/image/webp/7b2b8da6-8f8e-4646-8d4a-4710c516c01e_25567)


!["[Hamster-Coder] Bollinger Bands" โลโก้](https://cdn.ctrader.com/image/webp/21d8e5d6-fb11-4bac-b9ee-cd05c2b76804_30327)


ราคา
24
การขาย
662
ติดตั้งฟรี