
RSI Advanced
Indicador
1 compras
Versión 1.0, Apr 2026
Windows, Mac
5.0
Valoraciones: 1

Descripción
El Índice de Fuerza Relativa (RSI) estándar es uno de los indicadores más populares del mundo, pero trazar una sola línea en la parte inferior de tu gráfico es una forma anticuada de operar. Hace difícil detectar verdaderos cambios de impulso, aceleración y movimientos laterales del mercado.
El RSI Avanzado reinventa completamente este oscilador clásico. Al introducir una Línea de Señal, Filtrado de Volatilidad y Pintura Inteligente del Gráfico, transforma el RSI en un panel integral todo en uno para el seguimiento del impulso y la tendencia.
Características Clave
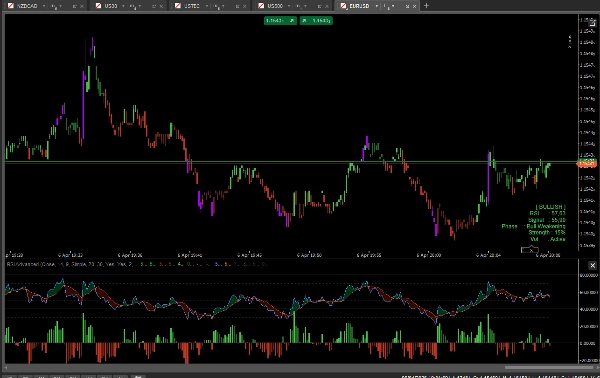
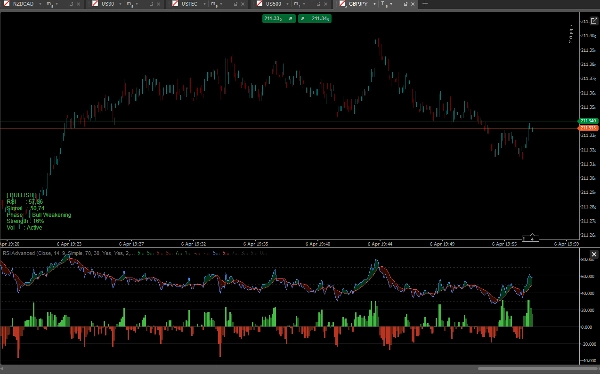
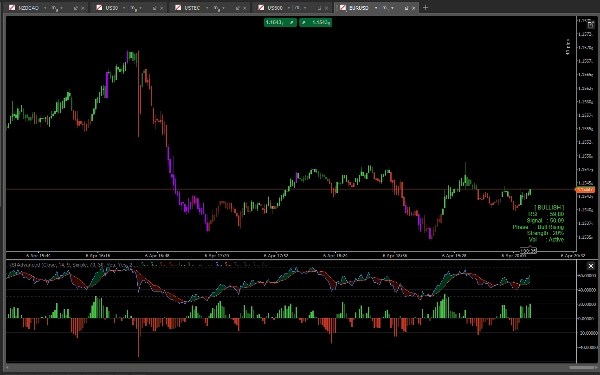
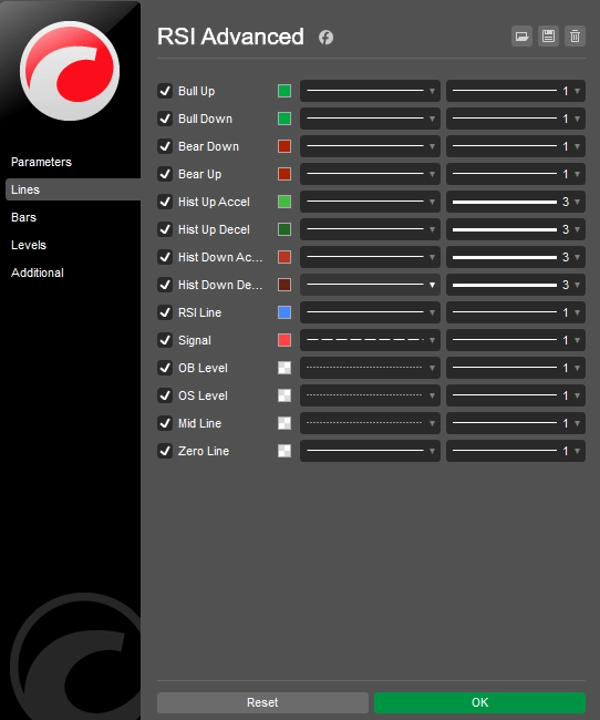
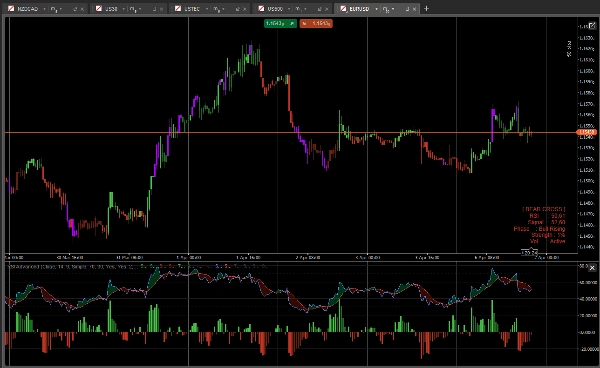
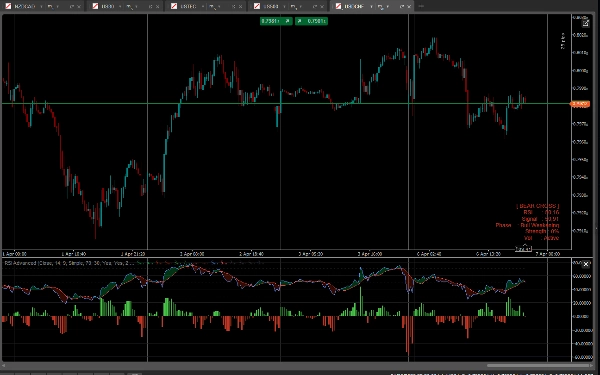
- RSI y Nube de Señal: Añadimos una Media Móvil (Línea de Señal) al RSI. El espacio entre el RSI y su Línea de Señal se llena con una Nube dinámica. Si la nube es Verde, los toros están impulsando el momentum. Si es Roja, los osos están en control.
- Histograma de Momentum: Un histograma centrado rastrea la distancia exacta entre el RSI y la Línea de Señal. Con colores incorporados de aceleración/desaceleración (brillante vs. oscuro), puedes anticipar cruces y agotamiento del momentum antes de que ocurran.
- Coloración Inteligente de Barras (Paintbars): Tus velas cambiarán de color según el momentum subyacente del RSI:
-
- Verde/Rojo Brillante: Alineación fuerte alcista/bajista (RSI > 50 y RSI > Señal).
- Verde/Rojo Oscuro: Momentum débil o retrocesos.
- Púrpura/Magenta: Niveles extremos de Sobrecompra (OB) o Sobreventa (OS) – advirtiéndote de posibles reversiones.
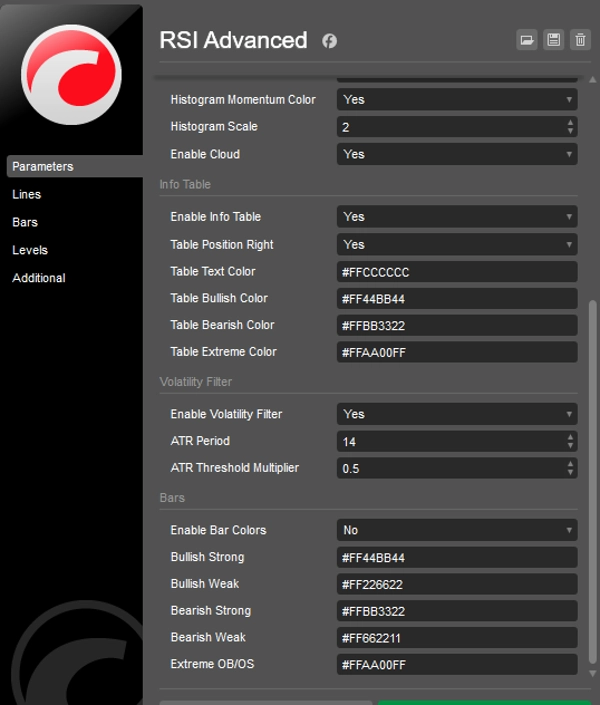
- Filtro Inteligente de Volatilidad (ATR): ¿Cansado de ser atrapado en mercados planos? Activa el filtro ATR incorporado. Cuando la volatilidad cae por debajo de tu promedio histórico, las velas y el histograma se vuelven grises, manteniéndote fuera de operaciones malas.
- Panel de Información en el Gráfico: Un panel de datos elegante muestra métricas en tiempo real: valores exactos de RSI y Señal, Fase de Momentum, porcentaje de Fuerza de Tendencia y Estado de Volatilidad.
- Completamente Desbloqueado: Opera en CUALQUIER símbolo (Forex, Cripto, Índices, Acciones) y CUALQUIER marco temporal sin limitaciones. Acceso de por vida.
¿Cómo operar con él?
- Continuación de Tendencia: Busca retrocesos donde el RSI se mantenga por encima de la Línea Media 50, pero descienda ligeramente hacia la Línea de Señal. Cuando el Histograma acelera (verde brillante) y las velas se vuelven verde brillante, es una entrada fuerte de continuación.
- Reversiones: Cuando las velas se vuelven Púrpura (OB/OS extremo), espera a que el RSI cruce de nuevo sobre la Línea de Señal (la Nube cambia de color) para una configuración de reversión de alta probabilidad.
- Evitar Movimientos Laterales: Si el Filtro de Volatilidad vuelve tus barras grises, simplemente espera y no operes hasta que el mercado despierte.
Resumen
Perfil del indicador
Categoría del indicador
Volatilidad
Tipo de resultado
Filtro
Requisitos de datos
Únicamente barras
Señales admitidas
Cruce
Fuerza de la tendencia
Volatilidad
Valoraciones de clientes
5.0
Valoraciones: 1
5 | 100 % | |
4 | 0 % | |
3 | 0 % | |
2 | 0 % | |
1 | 0 % |
Valoraciones de clientes
April 11, 2026
The first thing that worked was timing feels less random, and a small account test feels safer.
Conversación
Preguntas frecuentes
BTCUSD
Forex
Signal
Indices
EURUSD
Commodities
GBPUSD
NZDUSD
RSI
AI
XAUUSD
NAS100
ATR
USDJPY
Los productos disponibles a través de cTrader Store, incluidos bots, indicadores y plugins para operar, son proporcionados por desarrolladores de terceros y están disponibles únicamente con fines informativos y de acceso técnico. cTrader Store no es un bróker, por lo que no proporciona asesoramiento de inversión, recomendaciones personales ni ninguna garantía de rentabilidad futura.


![Logotipo de "Gaussian Channel [Iridio Capital]"](https://cdn.ctrader.com/image/webp/7c039209-5573-4a54-a072-f9528b503103_41960)


Precio
24
Ventas
662
Instalaciones gratis