
Beschreibung
🚀 Channel Breakout System
Dieser spezialisierte Algorithmus ist darauf ausgelegt, Ein- und Ausstiegspunkte präzise zu bestätigen 🎯, indem mehrere Elemente der technischen Analyse kombiniert werden, um zuverlässige Signale zu liefern.
🔍 Wie funktioniert es?
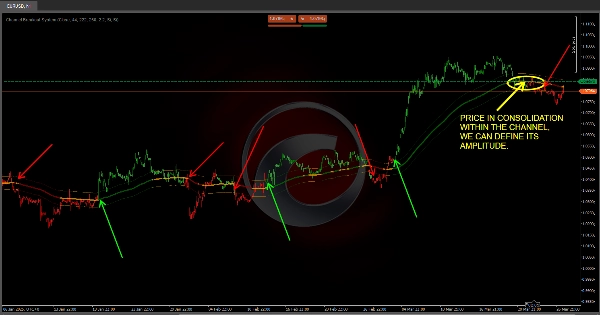
📊 Volatilitätsbasierter Kanal (ATR)
✅ Die Marktvolatilität wird mit dem ATR (Average True Range) 📉 berechnet.
✅ Der "Trend MA" wird angepasst, indem ein Wert proportional zu dieser Volatilität hinzugefügt und subtrahiert wird, wodurch zwei gepunktete Linien entstehen, die als "Decke" und "Boden" des Marktes fungieren.
✅ Was bedeutet das für Sie? Wenn der Preis innerhalb des Kanals bleibt, könnte der Markt sich in einer Seitwärtsbewegung oder Konsolidierung befinden; wenn er klar ausbricht, ist das ein Signal für eine starke Trendbewegung 📈📉.
✅ Vollständig anpassbar! Passen Sie die Kanaleinstellungen an Ihre Strategie an 📌.
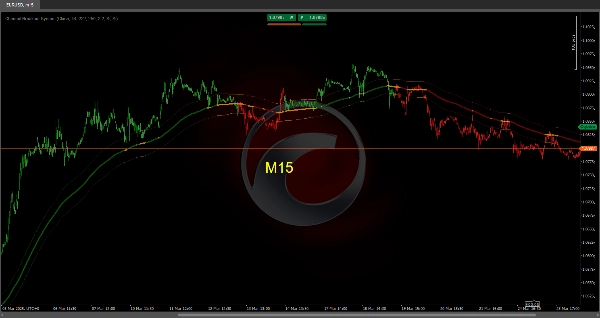
🟢 Trenderkennung mit intelligenten Farben
🔹 Der Indikator vergleicht die Position des schnellen MA mit dem mittleren MA und beide in Bezug auf den Trend MA.
🔹 Je nach Marktphase ändern die Kerzen ihre Farbe:
- 🟢 Grün → Bullische Marktphase.
- 🔴 Rot → Bärische Marktphase.
- 🟠 Orange oder neutral → Mögliche Konsolidierung oder Unsicherheit.
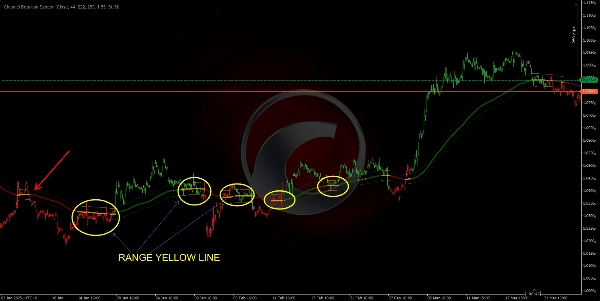
🔹 Wenn der Preis und die gleitenden Durchschnitte "im Kanal feststecken", signalisiert dies eine Konsolidierungsphase, die Ihnen hilft, das Trading in unentschlossenen Zonen zu vermeiden.
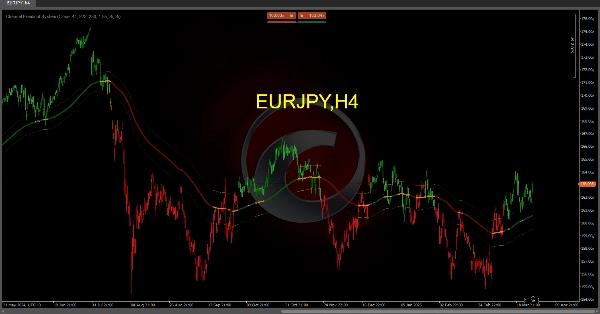
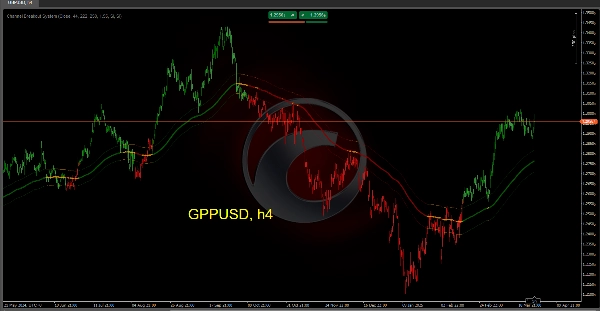
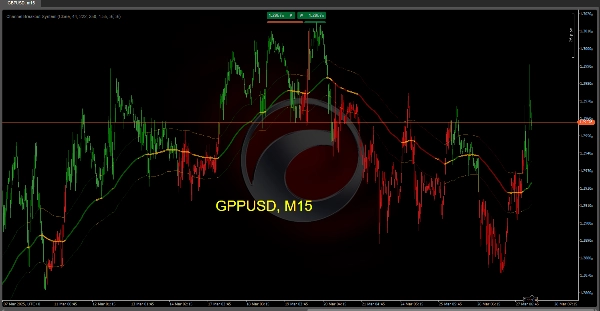
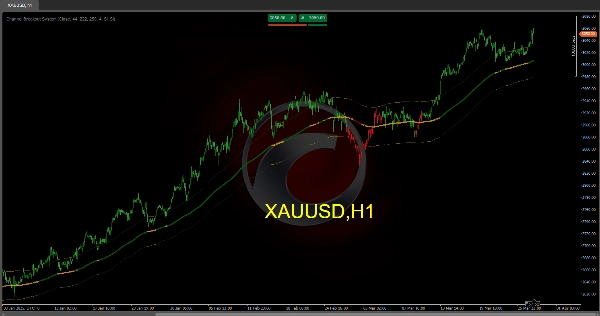
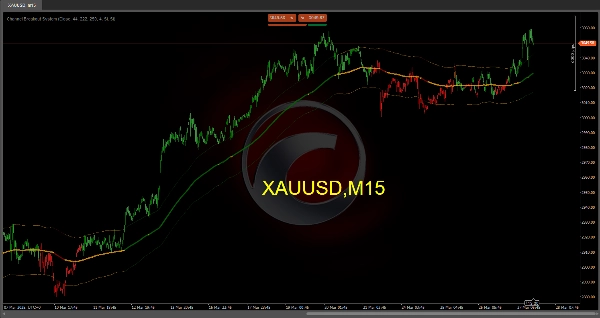
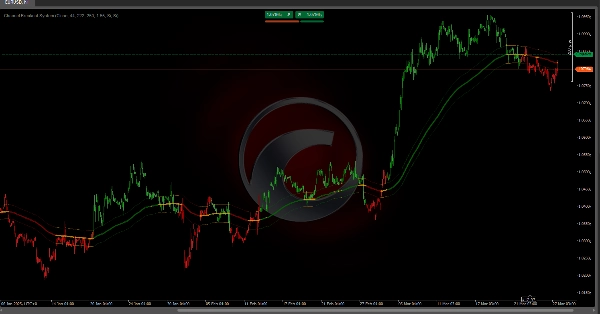
🎯 So sieht es im Chart aus
🔵 Haupt-Trendlinie: Ändert die Farbe je nach Marktrichtung (grün, rot oder orange).
📏 Gepunkteter Kanal: Spiegelt die Marktrange basierend auf der Volatilität wider.
📊 Farbige Balken: Bieten eine einfache visuelle Darstellung der aktuellen Marktphase.
🚀 Warum dieses System verwenden?
✔ Erkennt schnell, ob der Markt trendet oder seitwärts läuft.
✔ Hebt visuell hervor Trendstärke und -richtung.
✔ Erwartet potenzielle Umkehrungen mit klaren Ausbruchs- und Kreuzungssignalen.
✔ Bestätigt Ein- und Ausstiegspunkte, reduziert Fehlsignale und verbessert die Handelsgenauigkeit.
🔹 Optimieren Sie Ihr Trading und handeln Sie mit mehr Vertrauen mit dem Channel Breakout System 🏆. Machen Sie sich bereit, die besten Marktchancen zu erkennen! 📈🔥
Ctrader Store Indikatoren:
Dynamic Market Structure
Analysis of Turning Points
Fibonacci Linear
Regression Multi-timeframe
Multi-Level Candle Bias
Tracker
Auto Support and
Resistance Trend Lines
All Support and
Resistance Levels
Zusammenfassung
The system features smart color-coded trend detection by comparing fast, medium, and trend MAs, with candles changing color to indicate market phases: green for bullish, red for bearish, and orange for consolidation or uncertainty. This visual aid helps identify trend strength, direction, and potential consolidation zones.
On the chart, the main trend line changes color based on market direction, the dotted channel reflects volatility-based range, and colored bars provide an easy visual representation of the current market phase.
The indicator is fully customizable to fit different trading strategies. It aims to quickly identify trending or ranging markets, anticipate potential reversals with breakout and crossover signals, and confirm entry and exit points to reduce false signals and improve trade accuracy.
Kundenbewertungen
5 | 33 % | |
4 | 67 % | |
3 | 0 % | |
2 | 0 % | |
1 | 0 % |


