
ProVWAP
Indikator
6 käufe
Version 1.0, May 2025
Windows, Mac
4.5
Bewertungen: 2
Beschreibung
ProVWAP – Ihr verankerter VWAP & Volatilitätsbänder für cTrader
Übernehmen Sie die Kontrolle über Ihre Trades mit ProVWAP, dem ultimativen VWAP-Werkzeugkasten, der für alle Handelsstile entwickelt wurde.
🔧 Hauptmerkmale
Zusammenfassung
KI-Zusammenfassung
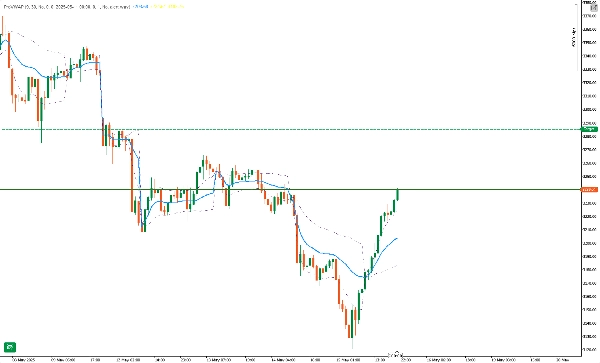
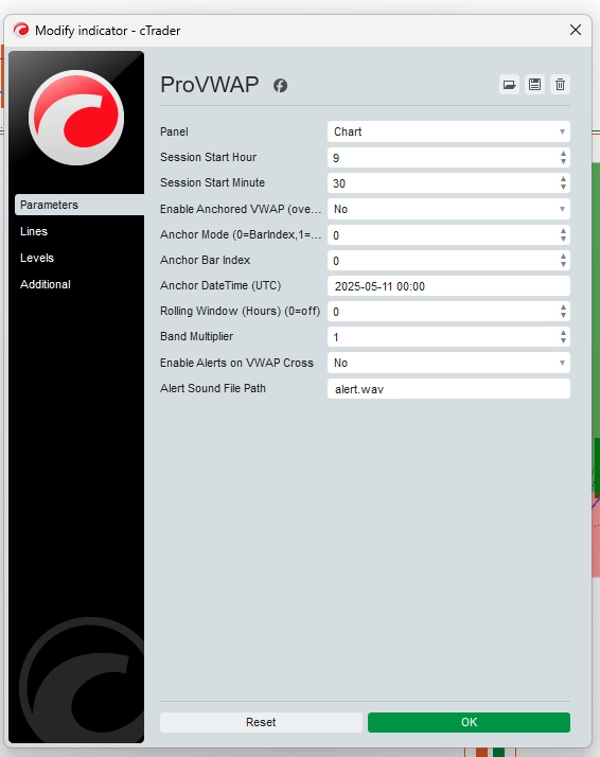
ProVWAP is an advanced indicator for the cTrader platform that provides anchored Volume Weighted Average Price (VWAP) analysis combined with volatility bands. It allows traders to anchor the VWAP at any specific candle index or exact date/time, enabling precise tracking of price action from pivotal points. The indicator supports customizable session resets, automatically restarting VWAP calculations at user-defined times to align with trading sessions.
Key features include a rolling window VWAP calculation over recent hours to capture dynamic trends, and volatility bands based on standard deviation to assess price strength and potential breakout zones. ProVWAP offers smart visual and audible alerts when price crosses the anchored VWAP, aiding timely decision-making. Its clean, non-intrusive overlay works across all timeframes.
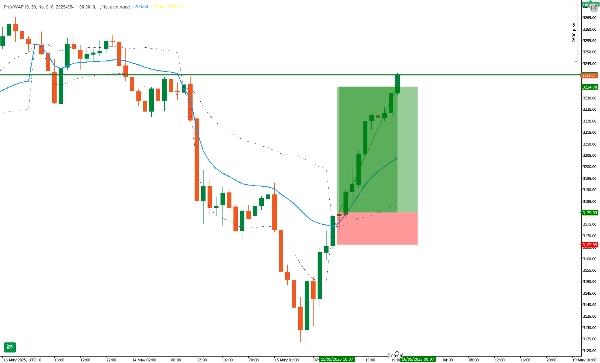
The tool is designed to reveal institutional fair-value zones, offering flexibility to tailor anchoring and analysis windows to individual strategies. It supports early-warning signals for breakouts and reversals. A sample strategy for Gold (XAU/USD) on a 1-hour timeframe demonstrates usage with session resets, band multipliers, and entry/exit rules based on price action relative to bands and RSI.
ProVWAP includes position management features such as stop-loss placement near the anchored VWAP, take-profit targets at risk-reward ratios or band touches, and trailing stops based on ATR. The license is tied to a cTrader account and includes lifetime updates and dedicated support.
Key features include a rolling window VWAP calculation over recent hours to capture dynamic trends, and volatility bands based on standard deviation to assess price strength and potential breakout zones. ProVWAP offers smart visual and audible alerts when price crosses the anchored VWAP, aiding timely decision-making. Its clean, non-intrusive overlay works across all timeframes.
The tool is designed to reveal institutional fair-value zones, offering flexibility to tailor anchoring and analysis windows to individual strategies. It supports early-warning signals for breakouts and reversals. A sample strategy for Gold (XAU/USD) on a 1-hour timeframe demonstrates usage with session resets, band multipliers, and entry/exit rules based on price action relative to bands and RSI.
ProVWAP includes position management features such as stop-loss placement near the anchored VWAP, take-profit targets at risk-reward ratios or band touches, and trailing stops based on ATR. The license is tied to a cTrader account and includes lifetime updates and dedicated support.
Indikatorprofil
Kundenbewertungen
4.5
Bewertungen: 2
5 | 50 % | |
4 | 50 % | |
3 | 0 % | |
2 | 0 % | |
1 | 0 % |
Kundenbewertungen
November 9, 2025
ProVWAP keeps your trades grounded ⚖️ - a clean, flexible VWAP tool with multi-session support and smooth performance. Perfect for spotting fair-value zones and intraday bounces. Add deviation bands and alerts, and it’d be near perfect for volume-based strategy lovers.
May 29, 2025
Diskussion
Häufig gestellte Fragen (FAQ)
Breakout
Indices
Commodities
RSI
XAUUSD
ATR
VWAP
Über den cTrader Store verfügbare Produkte, einschließlich Handelsbots, Indikatoren und Plugins, werden von externen Entwicklern bereitgestellt und nur zu Informations- und technischen Zugriffszwecken verfügbar gemacht. cTrader Store ist kein Broker und erbringt keine Anlageberatung, persönlichen Empfehlungen oder eine Garantie für zukünftige Performance.


Das könnte Sie auch noch interessieren


Preis
Seit 22/11/2024
135
Verkäufe
2.6K
Kostenlose Installationen