

Beschreibung
🧠 Fortschrittlicher RSI-Indikator – Präzise Momentum-Analyse
Gewinnen Sie tiefere Einblicke in Markttrends mit einem intelligenteren RSI
Der Fortschrittliche RSI-Indikator ist eine leistungsstarke Weiterentwicklung des klassischen RSI-Werkzeugs, entwickelt für Trader, die Wert auf Präzision und intelligente Signalfilterung legen. Mit fortschrittlicher algorithmischer Glättung, adaptiven Zonen und integrierter Divergenzerkennung bietet dieses Tool eine verfeinerte Momentum-Analyse für alle Märkte und Zeitrahmen.
🔍 Hauptmerkmale:
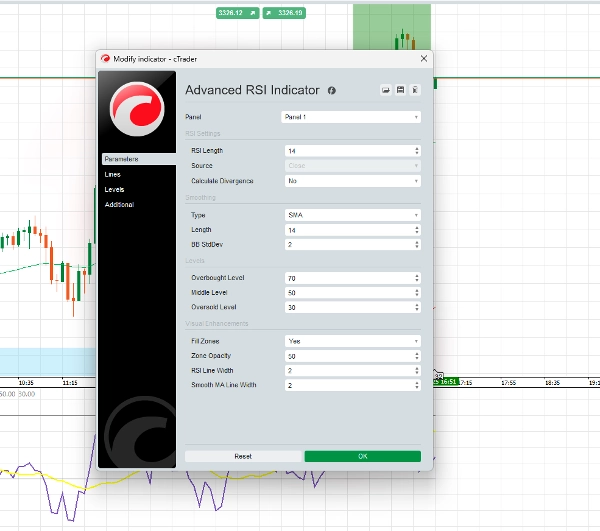
✅ Geglättete RSI-Kurve
Reduziert unruhige Bewegungen und Fehlsignale für klarere Einblicke in Markttrends.
✅ Adaptive Signalzonen
Geht über die traditionellen 70/30-Niveaus hinaus mit dynamischen Schwellenwerten, die auf die Marktvolatilität reagieren.
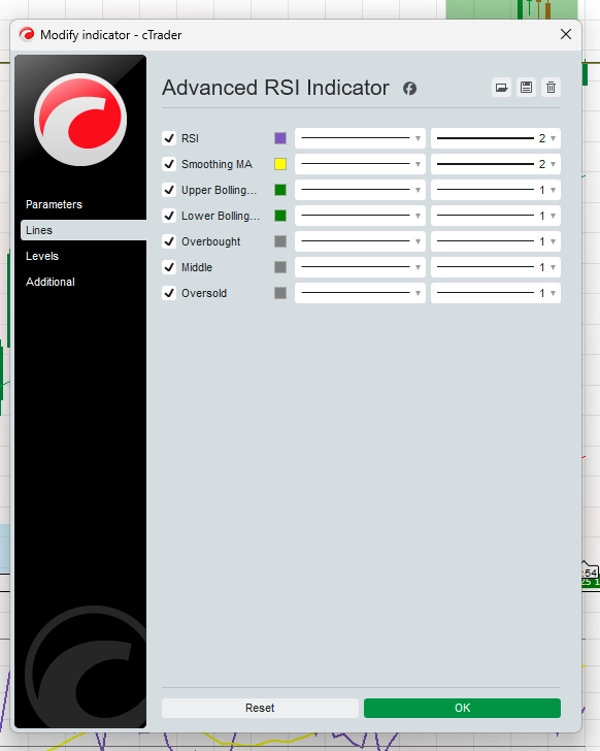
✅ Farbkodierte Momentum-Zonen
Schnelle Einschätzung von bullischem oder bärischem Momentum durch ein intuitives visuelles Design.
✅ Divergenz-Alarme
Hebt bullische und bärische Divergenz-Setups hervor, um strategische Entscheidungen zu unterstützen.
✅ Benutzerdefiniertes Alarmsystem
Richten Sie Alarme für RSI-Level-Überschreitungen und Divergenzsignale ein, damit Sie keine wichtigen Momente verpassen.
✅ Multi-Asset, Multi-Timeframe
Optimiert für den Einsatz in Forex, Krypto, Aktien, Indizes und mehr – von M1 bis zu Tagescharts.
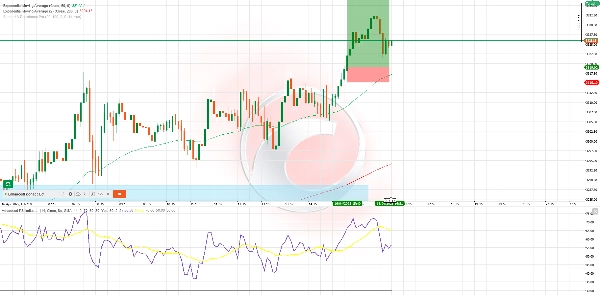
⚙️ Strategie-Beispiel – RSI Wave Ride
Am besten geeignet für: H1 & H4 Swing-Trades
Verwendete Indikatoren: Fortschrittlicher RSI, 50 EMA, 200 EMA
Kaufbeispiel:
- Preis liegt über 50 & 200 EMA
- RSI fällt unter 40 und beginnt zu steigen
- Bullische Momentum-Farbe erscheint
- (Optional) Bullische Divergenz erkannt
- Einstieg: Kerzenschluss über dem Signal
- SL: Unter dem letzten Swing-Tief
- TP: 1,5x–2x des Risikos oder jüngster Widerstand
Verkaufbeispiel:
- Preis liegt unter 50 & 200 EMA
- RSI steigt über 60 und beginnt dann zu fallen
- Bärische Momentum-Farbe bestätigt die Richtung
- (Optional) Bärische Divergenz verstärkt das Signal
- Einstieg: Bestätigung durch Kerzenschluss
- SL: Über dem letzten Swing-Hoch
- TP: 1,5x–2x des Risikos oder jüngste Unterstützung
💬 Warum Trader dieses Tool wählen:
- Benutzerfreundlich, aber leistungsstark
- Nicht nachzeichnende Signale
- Getestet in den wichtigsten Märkten
- Kann eigenständig oder zusammen mit anderen Strategien verwendet werden
Zusammenfassung
Kundenbewertungen
5 | 100 % | |
4 | 0 % | |
3 | 0 % | |
2 | 0 % | |
1 | 0 % |


![„[Hamster-Coder] Pivot Points MTF“-Logo](https://cdn.ctrader.com/image/webp/4c143e5a-309c-40e3-a578-f04d1e133ffa_31159)