
KasePeakOscillator
Gösterge
45 i̇ndirmeler
Sürüm 1.0, May 2026
Windows, Mac
5.0
Değerlendirmeler: 1
Başlangıç 21/02/2025
466.3M
İşlem hacmi
180.83K
Kazanılan pip
22
Satışlar
6.87K
Ücretsiz yüklemeler
Açıklama
KasePeakOscillator (KPO) gelişmiş bir teknik analiz aracıdır ve piyasa tükenişini, trend dönüşlerini ve momentum değişimlerini belirlemek için tasarlanmıştır. Standart osilatörlerin aksine, KPO, değişen piyasa koşullarında daha güvenilir sinyaller sağlamak için istatistiksel volatilite ölçümlerini entegre eder.
Nasıl Çalışır: Gösterge, fiyat hareketi ile tarihsel volatilite (Ortalama Günlük Aralık/Standart Sapma) arasındaki ilişkiyi hesaplar. Bir fiyat hareketinin istatistiksel olarak anlamlı mı yoksa sadece piyasa gürültüsü mü olduğunu belirlemek için "Kısa Döngüleri" "Uzun Döngülere" karşı değerlendirir. Sonuç, sıfır çizgisi etrafında salınan, pürüzsüz ve duyarlı bir osilatördür.
Ana Bileşenler:
- Histogram (KCD): Temel momentumu temsil eder. Sıfır çizgisinin kesişimi kısa vadeli trend eğiliminin değiştiğini gösterir.
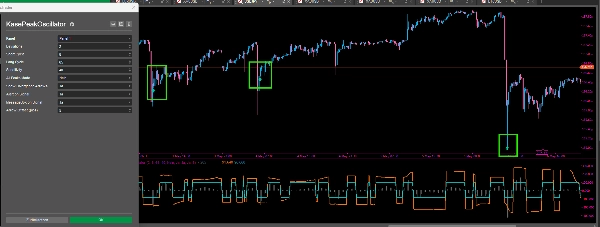
- Dinamik Bantlar (Üst/Orta): Bunlar istatistiksel "aşırı alım" ve "aşırı satım" eşik değerleri olarak işlev görür. Piyasa volatilitesine uyum sağlar, yüksek aktivite dönemlerinde genişler ve konsolidasyon sırasında daralır.
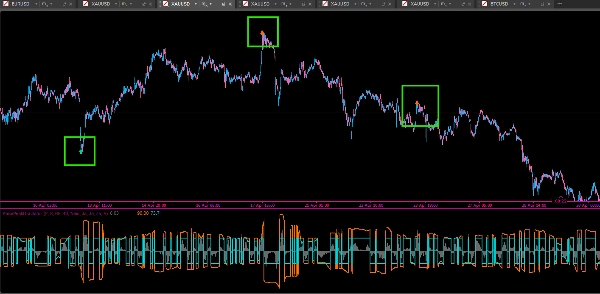
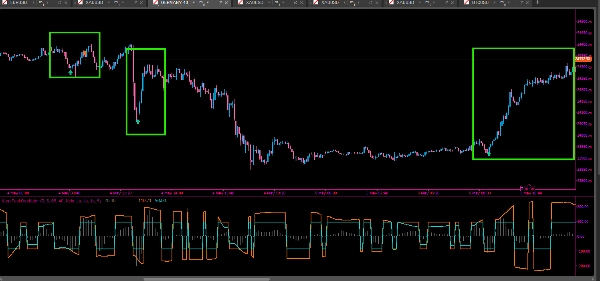
- Otomatik Tepe Tespiti: Gösterge, momentumu istatistiksel bir uç noktaya ulaştığı "Tepe" ve "Dip"leri tanımlar ve potansiyel tükenişi işaret eder.
Ticaret Stratejisi:
- Tepe Tükenişi: Momentum tepe noktası dinamik bantların dışında gerçekleştiğinde (Mint veya Turuncu oklarla gösterilir), mevcut trendin aşırı genişlediğini ve bir dönüş veya düzeltmenin muhtemel olduğunu gösterir.
- Uyumsuzluk Sinyalleri: KPO, Otomatik olarak Boğa ve Ayı Uyumsuzluklarını tanımlar. Fiyat yeni bir uç nokta yaparken osilatör bunu yapamazsa, momentumun zayıfladığını gösterir. Bunlar Açık Mavi (Boğa) ve Altın (Ayı) simgeleriyle işaretlenir.
- Trend Onayı: Trend yönünü onaylamak için Histogram'ın sıfır çizgisine göre konumunu kullanın. Sıfırın üzerinde kalmak uzun pozisyonları desteklerken, sıfırın altında kalmak kısa pozisyonları destekler.
Özellikler:
- Entegre Uyarı Sistemi (Ses, Mesaj Kutusu ve Görsel Simgeler).
- Farklı varlık sınıflarına (Forex, Endeksler, Kripto) uyacak şekilde ayarlanabilir hassasiyet.
- Agresif scalping için "Tüm Tepeler Modu" veya yüksek olasılıklı swing ayarları için filtrelenmiş mod.
Özet
YZ özeti
The KasePeakOscillator (KPO) is a technical indicator designed to detect market exhaustion, trend reversals, and momentum shifts by integrating price action with statistical volatility measures. It calculates the relationship between short-term and long-term price cycles adjusted for historical volatility, producing a smooth oscillator around a zero line.
Key components include:
- Histogram (KCD): Represents core momentum; zero-line crossings indicate short-term trend changes.
- Dynamic Bands: Volatility-adjusted thresholds signaling overbought or oversold conditions.
- Automated Peak Detection: Identifies momentum extremes signaling potential trend exhaustion.
The KPO provides automated alerts for peak exhaustion and divergence signals, marking bullish and bearish divergences when price and momentum disagree. Trend direction can be confirmed by the histogram’s position relative to zero.
Features include adjustable sensitivity for various asset classes such as Forex, indices, and cryptocurrencies, an integrated alert system (sound, message, visual icons), and modes tailored for scalping or swing trading. The indicator supports analysis based on price bars and outputs reversal and divergence signals to assist in trading decisions.
Gösterge profili
Gösterge kategorisi
Momentum
Çıktı türü
Sinyaller
Veri gereklilikleri
Yalnızca çubuklar
Desteklenen sinyaller
Yön değiştirme
Sapma
Müşteri değerlendirmeleri
5.0
Değerlendirmeler: 1
5 | 100 % | |
4 | 0 % | |
3 | 0 % | |
2 | 0 % | |
1 | 0 % |
Müşteri değerlendirmeleri
May 27, 2026
Reliable tool with a learning curve This indicator takes a little time to get used to, but once you understand how to read the signals properly it delivers solid results. Works best when combined with support and resistance levels and a clear market structure.
Tartışma
SSS
Key Levels
Volume
cTrader Store üzerinden erişilebilen işlem botları, göstergeler ve eklentiler gibi ürünler, üçüncü taraf sağlayıcılar tarafından sağlanır ve yalnızca bilgilendirme ve teknik erişim amaçlarıyla sunulur. cTrader Store bir broker değildir ve yatırım tavsiyesi, kişisel öneriler vermez veya gelecekteki performansı garanti etmez.


Fiyat
Başlangıç 21/02/2025
466.3M
İşlem hacmi
180.83K
Kazanılan pip
22
Satışlar
6.87K
Ücretsiz yüklemeler