Opis
Ten wskaźnik został zaprojektowany do przeprowadzania wielokrotnej regresji nieliniowej z użyciem czterech zmiennych niezależnych: cen zamknięcia, otwarcia, najwyższej i najniższej.
Oto składniki i funkcjonalności:
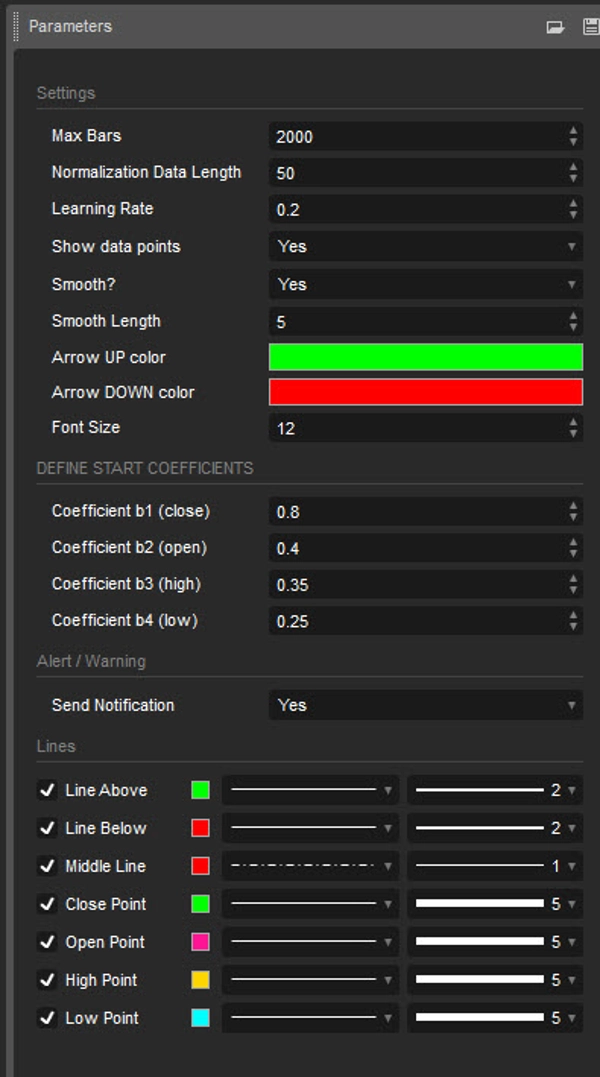
Wejścia:
- Długość danych do normalizacji: Długość danych używanych do normalizacji.
- Współczynnik uczenia: Tempo, w jakim algorytm uczy się na podstawie błędów.
- Pokaż punkty danych: Wyświetlanie wykresu znormalizowanych danych wejściowych (zamknięcie, otwarcie, najwyższa, najniższa)
- Wygładzać?: Opcja wygładzania wyniku.
- Długość wygładzania: Długość wygładzania, jeśli jest włączona.
- Zdefiniuj współczynniki początkowe: Początkowe współczynniki dla równania regresji.
Normalizacja danych:
Skrypt normalizuje dane wejściowe do zakresu od 0 do 1, używając najwyższych i najniższych wartości w określonej długości.
Regresja nieliniowa:
Oblicza równanie regresji używając współczynników wejściowych i znormalizowanych danych. Używane równanie to ważona suma zmiennych niezależnych, z współczynnikami dostosowywanymi iteracyjnie za pomocą spadku gradientu w celu minimalizacji błędów.
Obliczanie błędu:
Skrypt oblicza błąd między rzeczywistymi a przewidywanymi wartościami.
Spadek gradientu:
Współczynniki są aktualizowane iteracyjnie za pomocą spadku gradientu, aby zminimalizować błąd.
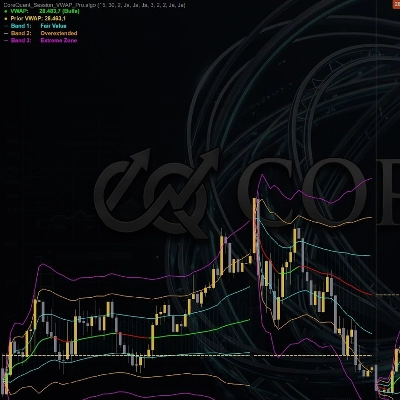
Wizualizacja:
- Wykres znormalizowanych danych wejściowych (zamknięcie, otwarcie, najwyższa, najniższa).
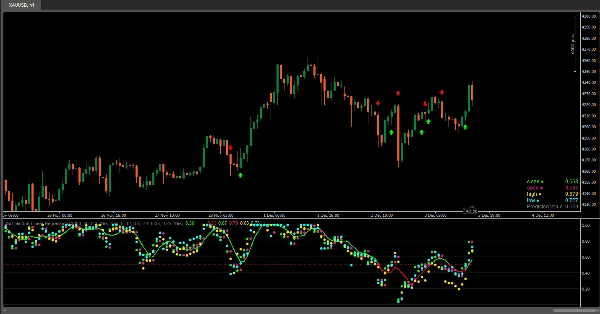
- Wskaźnik zapewnia wizualizację wartości znormalizowanych danych (zamknięcie, otwarcie, najwyższa, najniższa) w formie okrągłych znaczników na wykresie, umożliwiając użytkownikom łatwe obserwowanie względnych pozycji tych wartości względem siebie i linii regresji.
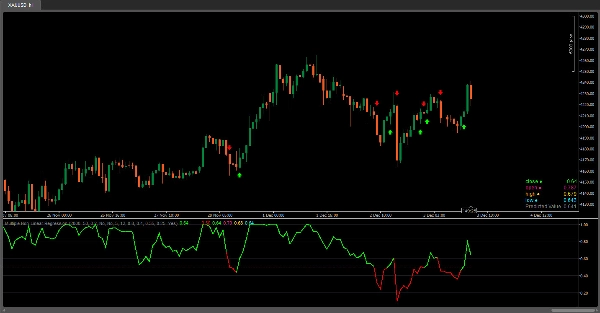
- Wykres linii regresji.
- Gradient kolorów na linii regresji w oparciu o jej wartość i kolory słupków.
- Wyświetlanie znormalizowanych danych wejściowych i przewidywanej wartości w tabeli.
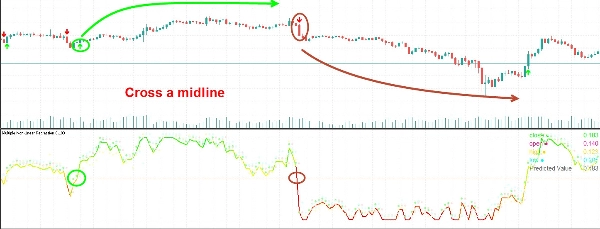
- Sygnały dla przecięć z linią środkową (0,5).
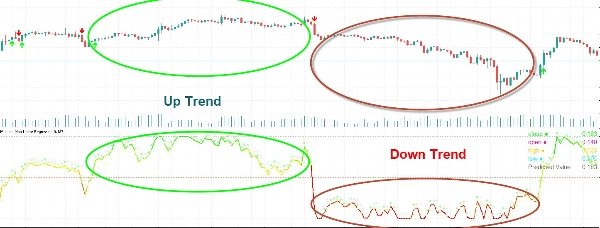
Interpretacja:
Użytkownicy mogą interpretować linię regresji i jej przecięcia z linią środkową (0,5) jako sygnały potencjalnych okazji do kupna lub sprzedaży.
Ten wskaźnik pomaga użytkownikom analizować zależności między wieloma zmiennymi i podejmować decyzje handlowe na podstawie analizy regresji. Dostosowanie współczynników i parametrów pozwala precyzyjnie dopasować wydajność modelu do specyficznych warunków rynkowych.
Podsumowanie
Opinie klientów
5 | 100 % | |
4 | 0 % | |
3 | 0 % | |
2 | 0 % | |
1 | 0 % |


![Logo „High-Low Divergence [Iridio Capital]”](https://cdn.ctrader.com/image/webp/443c4661-7abb-40f1-842f-4b6ec560649b_40914)