
Parabolic RSI Alert V1
Wskaźnik
3 zakupy
Wersja 1.0, Aug 2025
Windows, Mac
4.5
Opinie: 2
Opis
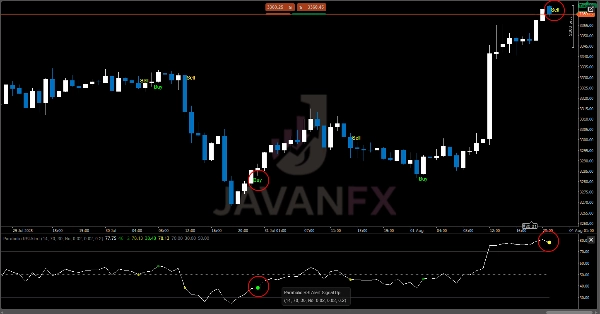
Paraboliczne powiadomienie RSI Parabolic RSI Alert to potężny wskaźnik łączący precyzję Relative Strength Index (RSI) z dynamicznymi możliwościami podążania za trendem niestandardowego Parabolic SAR. To unikalne połączenie pomaga traderom identyfikować punkty odwrócenia o wysokim prawdopodobieństwie za pomocą wyraźnych sygnałów wizualnych i powiadomień w czasie rzeczywistym.
Uwagi dotyczące użytkowania:
- Wskaźnik działa najlepiej na interwałach 1H i wyższych
- Silne sygnały pojawiają się, gdy odwrócenia mają miejsce w strefach wykupienia/wyprzedania
- Regularne sygnały pojawiają się, gdy odwrócenia występują poza strefami ekstremalnymi
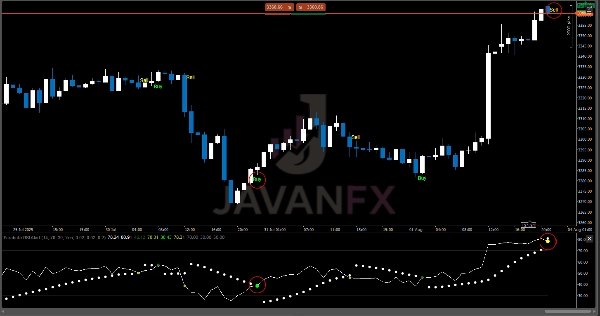
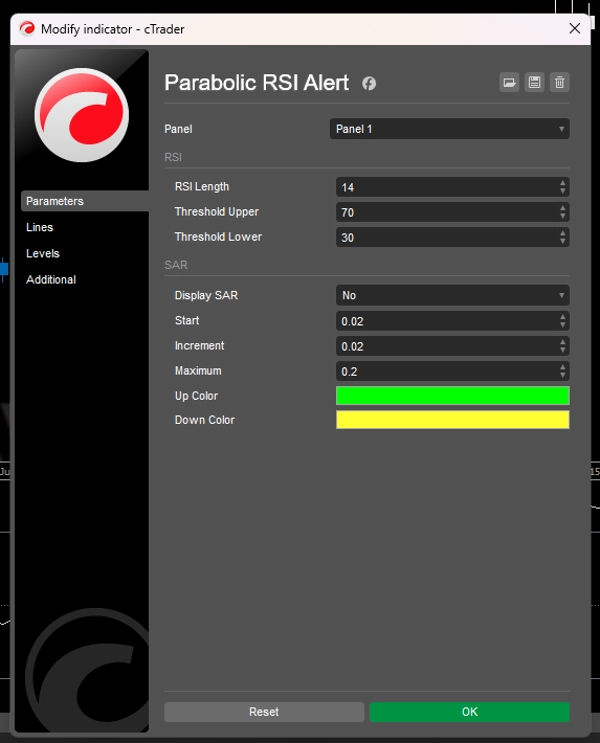
- Punkty SAR są wyświetlane tylko wtedy, gdy
Display SARjest włączone - Łącz z analizą cenową i innymi wskaźnikami, aby potwierdzić punkty wejścia i wyjścia (opcjonalnie).
Idealne dla traderów, którzy:
- Chcą zmniejszyć opóźnienie w tradycyjnej analizie RSI
- Potrzebują wyraźnych wizualnych i dźwiękowych powiadomień dla terminowych wejść
- Wolą mechaniczne sygnały zamiast subiektywnej analizy wykresów
Podsumowanie
Podsumowanie AI
The Parabolic RSI Alert indicator integrates the Relative Strength Index (RSI) with a custom Parabolic SAR to identify high-probability trend reversal points. It provides clear visual signals and real-time alerts to assist traders in timely decision-making. Designed for use on 1-hour and higher timeframes, the indicator highlights strong reversal signals particularly when they occur in overbought or oversold zones, while also signaling less extreme reversals. Parabolic SAR points are displayed when the corresponding option is enabled. This tool aims to reduce lag commonly associated with traditional RSI analysis and offers mechanical, objective signals supported by both visual and audible alerts. It is suitable for traders who prefer systematic entry and exit cues and can be combined with price action or other indicators for confirmation.
Profil wskaźnika
Opinie klientów
4.5
Opinie: 2
5 | 50 % | |
4 | 50 % | |
3 | 0 % | |
2 | 0 % | |
1 | 0 % |
Opinie klientów
October 10, 2025
Smooth combo! 🎯 Parabolic RSI Alert mixes momentum & trend perfectly — clean entries, fewer fakeouts. Great hybrid for swing or intraday setups.
August 18, 2025
Dyskusja
Częste pytania
Produkty dostępne za pośrednictwem cTrader Store, w tym boty handlowe, wskaźniki i wtyczki, dostarczane są przez deweloperów zewnętrznych i udostępniane wyłącznie w celach informacyjnych oraz w celu zapewnienia dostępu technicznego. cTrader Store nie jest brokerem i nie zapewnia doradztwa inwestycyjnego, nie udziela spersonalizowanych rekomendacji ani nie gwarantuje przyszłych wyników.


Cena
Od 14/07/2025
60
Sprzedaż